
LLM Observability for Production AI Systems
Author:
Jake Meany (Dir. of Marketing, LayerLens)
Last updated:
Published:
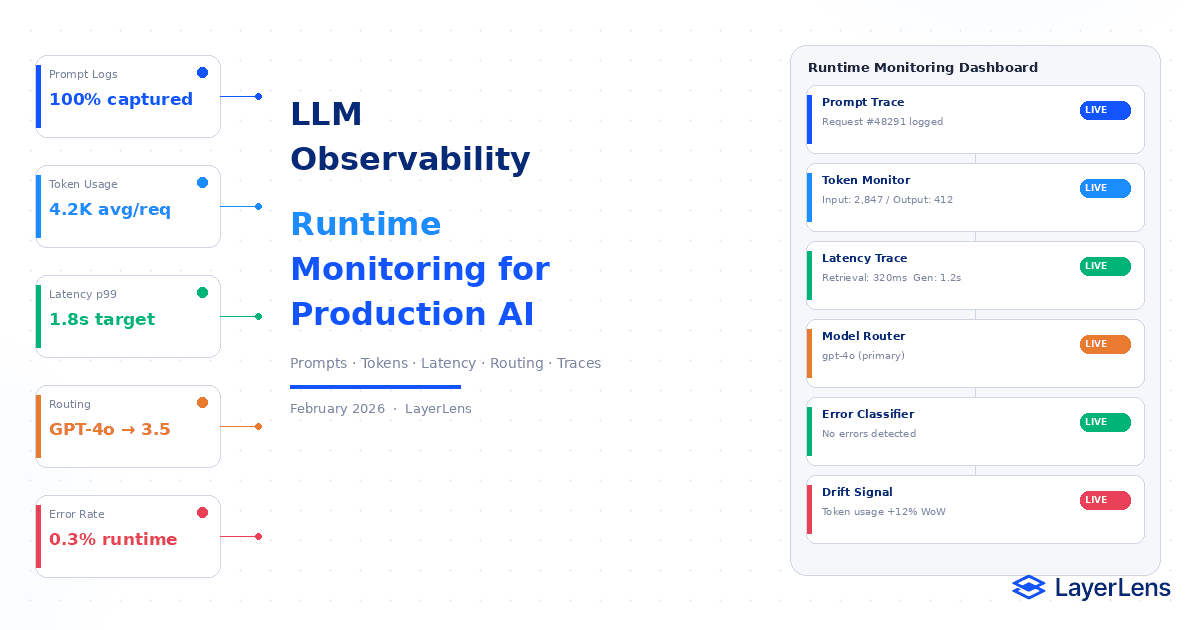
LLM observability provides runtime visibility into prompts, responses, token usage, routing decisions, and tool calls.
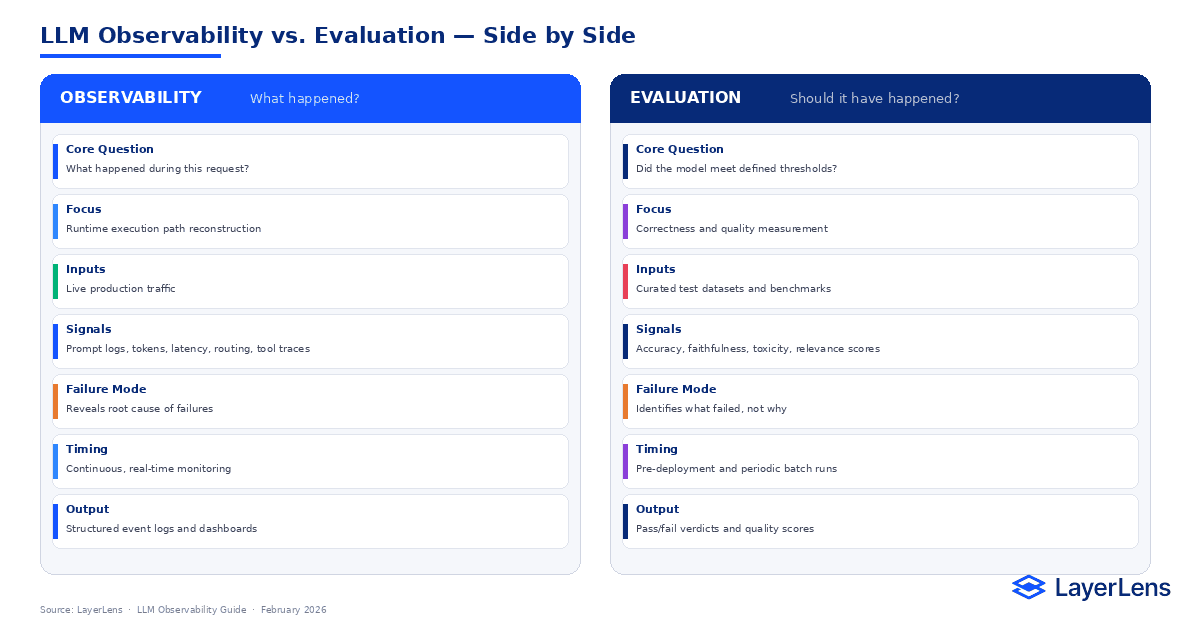
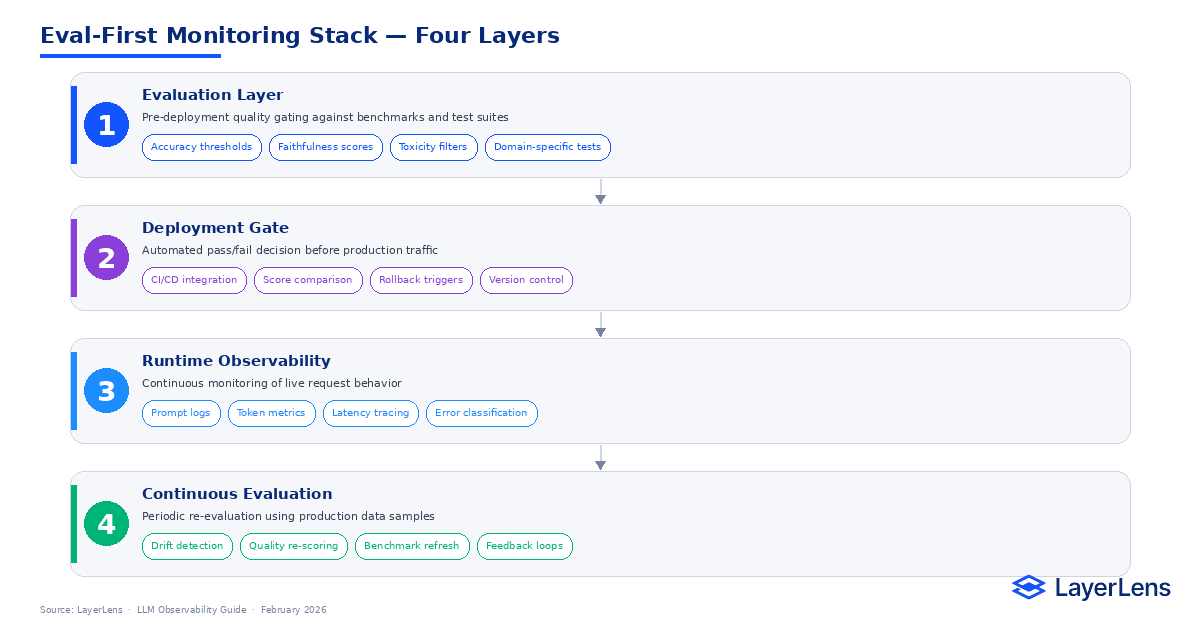
Evaluation answers whether output met a benchmark. Observability explains what actually happened.
Core llm monitoring signals include prompt-level logs, token usage metrics, latency distribution, model routing, and structured error classification.
LLM tracing enables reproducible debugging in production systems.
Observability must connect runtime signals directly to governance and deployment thresholds.
What Is LLM Observability?
LLM observability is the structured monitoring of model behavior in live production systems. It focuses on runtime transparency rather than offline benchmarking.
Where LLM evaluation frameworks determine whether a model meets defined performance thresholds (How to Build an LLM Evaluation Framework: https://layerlens.ai/blog/llm-evaluation-framework), observability reconstructs the full execution path of a specific request.
LLM observability captures:
The exact prompt and system instructions
Retrieved context injection
Model version and routing decisions
Token usage and truncation flags
Latency breakdown (retrieval, generation, tools)
Tool invocation traces
Error classification
For a detailed breakdown of evaluation metrics themselves, see LLM Evaluation Metrics That Actually Matter (https://layerlens.ai/blog/llm-evaluation-metrics-production).
Evaluation determines whether something passed. Observability explains why it behaved the way it did.
Why Runtime Visibility Matters
Production AI systems operate under evolving traffic patterns. Research on distribution shift in machine learning systems demonstrates that input behavior changes independently from training data.
When distribution shifts, models do not announce degradation. They change gradually. Latency increases. Token usage drifts. Routing logic adjusts. Refusal rates fluctuate.
Without observability, these signals surface only as user complaints.
Observability turns these patterns into measurable signals.
Core Components of LLM Observability
Prompt-Level Logging
Every production request should store the full prompt, system instructions, and injected retrieval context. Without this, debugging becomes speculative.
LayerLens provides structured prompt-level logging via Evaluation Dashboards.
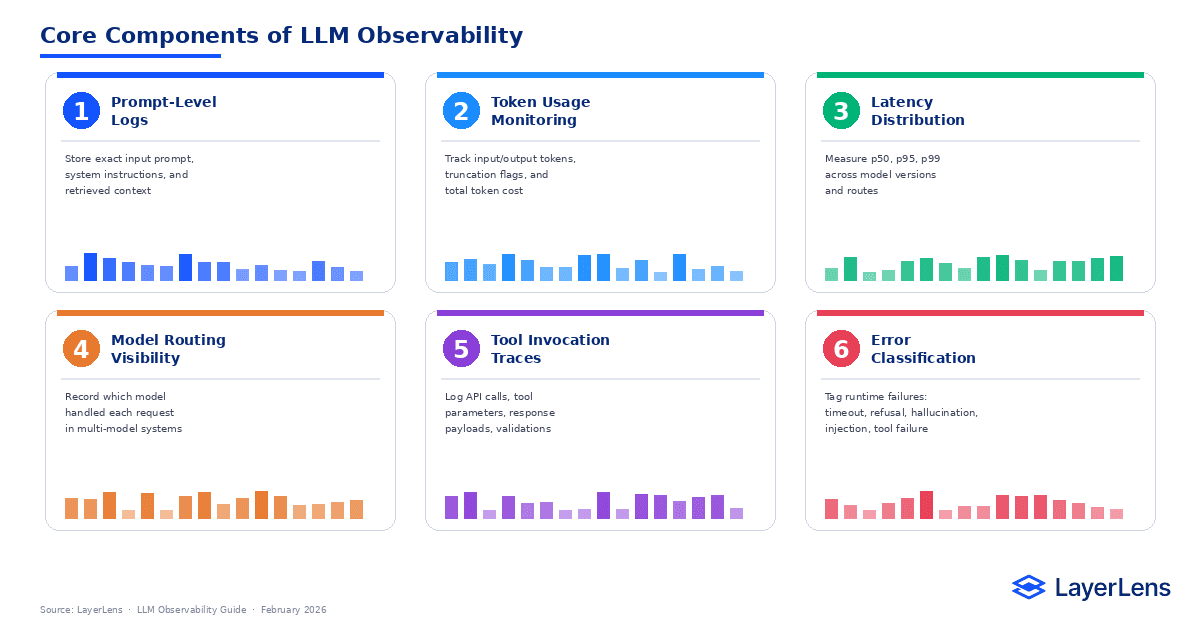
Token Usage Monitoring
Track input tokens, output tokens, truncation events, and cost per request. Token inflation is often the first signal of prompt template drift.
Latency Distribution
Measure p50, p95, and p99 latency across model versions and routing paths.
Model Routing Visibility
Log which model handled each request in multi-model deployments. You can compare behavior across models using Model Comparison Tools.
Tool Invocation Traces
Record API calls, parameters, and response payloads. Tool failures frequently appear as model hallucinations without trace-level logging.
Error Classification
Tag runtime events consistently: timeout, refusal, hallucination suspected, injection detected, tool failure.
For adversarial behavior analysis, see AI Red Teaming for LLMs.
How LLM Observability Enables Debugging
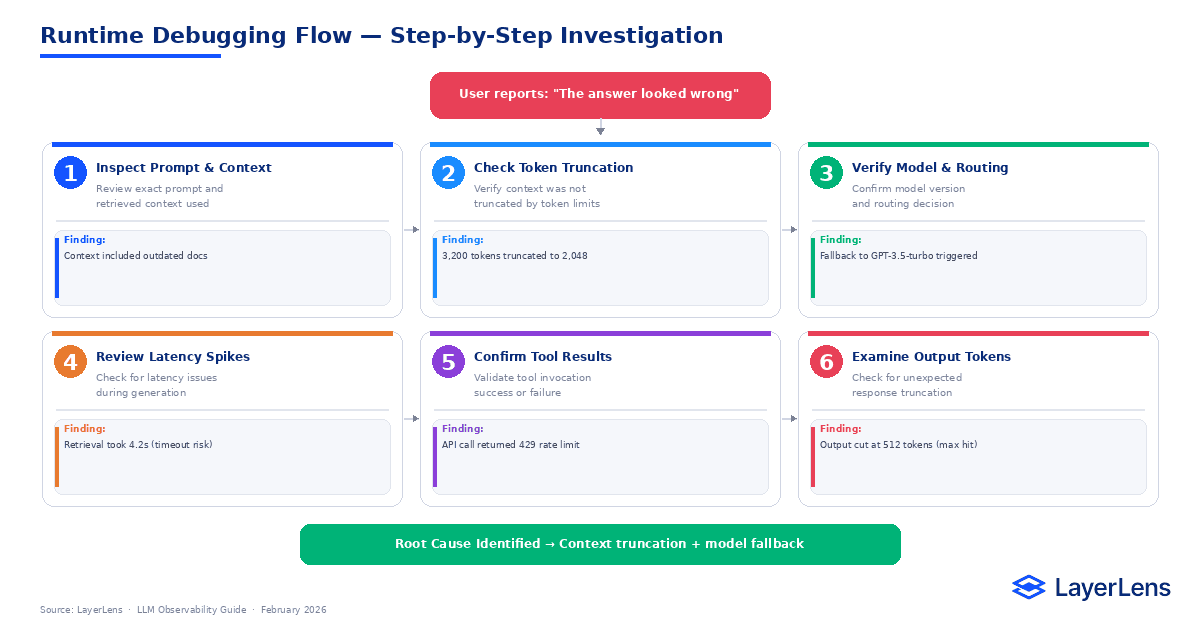
When a user reports “the answer was wrong,” runtime tracing allows structured investigation:
Inspect the exact prompt and retrieved documents.
Check token truncation and context window limits.
Verify model version and routing decisions.
Review latency breakdown.
Confirm tool invocation results.
For retrieval-specific runtime issues, see RAG Evaluation in Production.
This mirrors distributed tracing practices in software engineering such as OpenTelemetry, where request-level telemetry reconstructs execution paths.
Without observability, root cause remains guesswork.
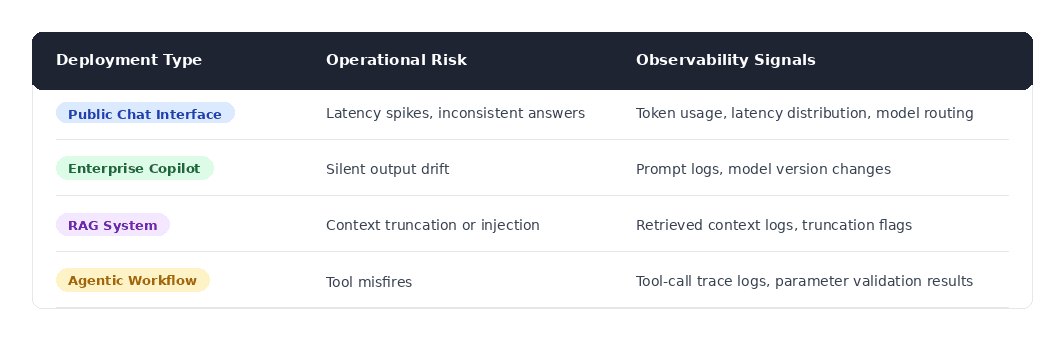
Observability KPI Mapping
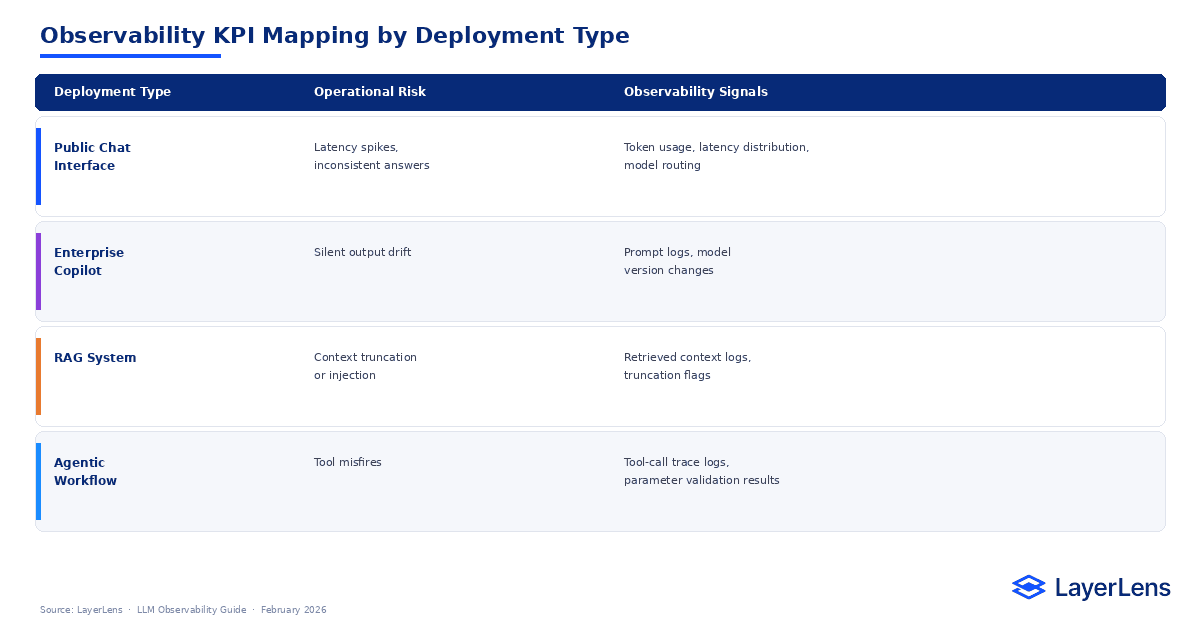
Observability connects runtime events directly to operational risk.
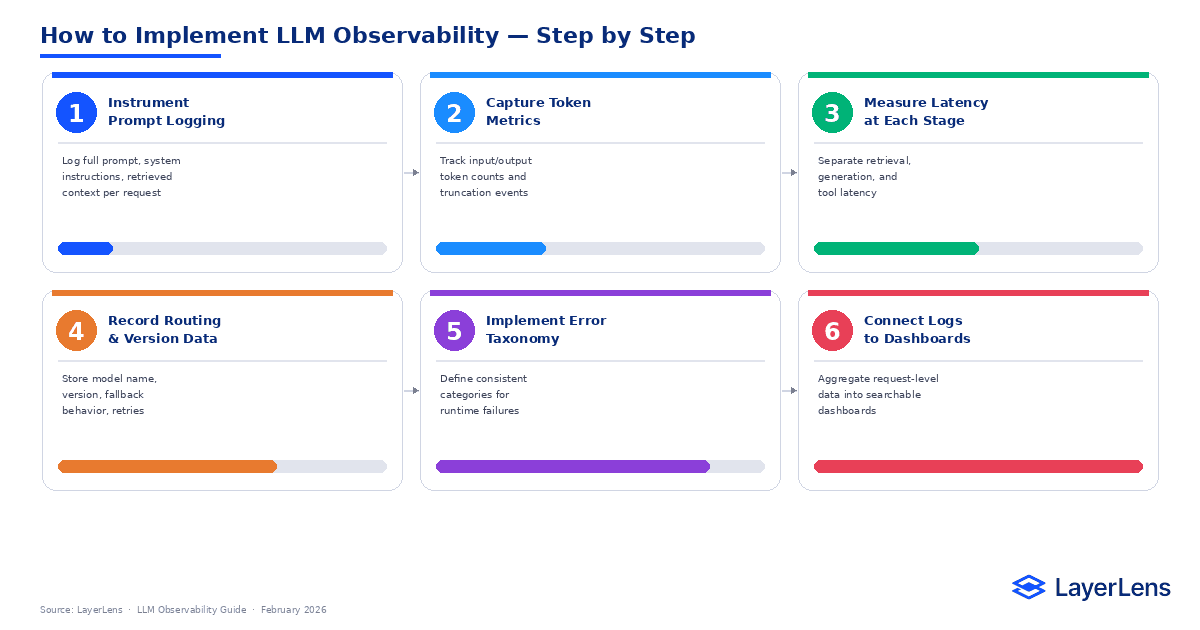
How to Implement LLM Observability
Instrument prompt logging
Capture token metrics
Measure latency breakdown
Record routing and version metadata
Implement structured error taxonomy
Surface logs in searchable dashboards
LayerLens Stratix Premium integrates prompt logs, routing visibility, and enterprise dashboards.
Production LLM Tracing Checklist
For each request, log:
Timestamp
Prompt template version
Retrieved document identifiers
Input tokens
Output tokens
Truncation indicator
Latency (retrieval, generation, tool)
Model version
Routing decision
Tool calls and return codes
Safety classifier outputs
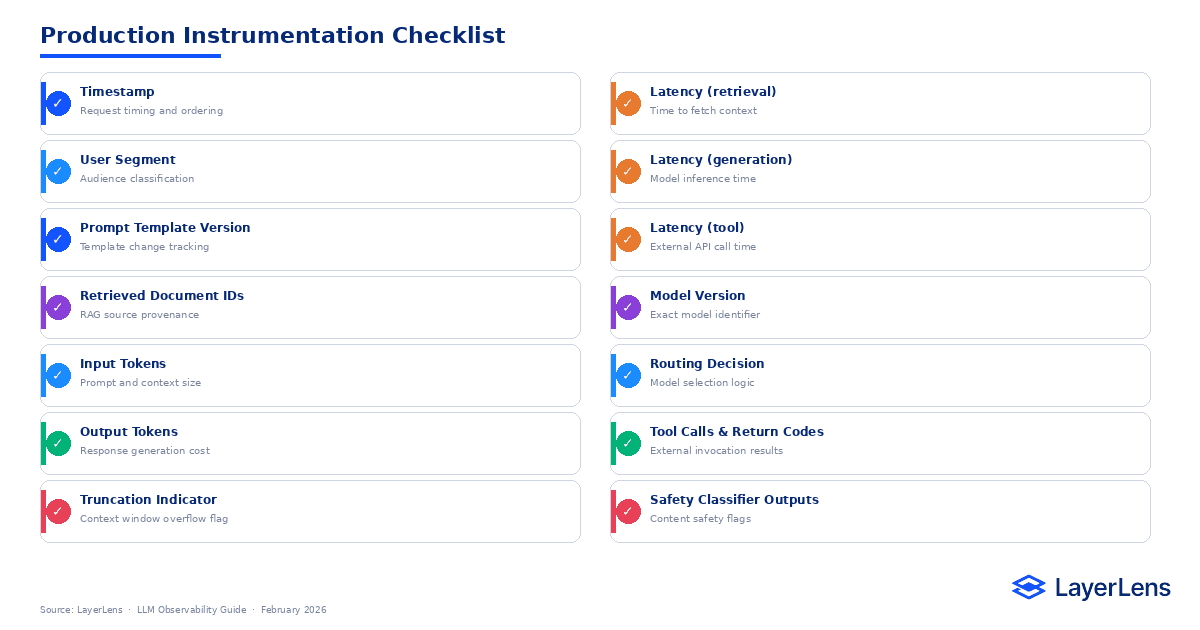
These signals should feed centralized dashboards.
Detecting Runtime Drift
Runtime drift differs from benchmark drift described in LLM Evaluation Frameworks.
Signals include:
Sudden token usage increases
Latency distribution shifts
Routing pattern changes
Refusal rate spikes
Tool failure rate increases
Distribution shift research shows these shifts often precede visible degradation.
Observability isolates the cause before it becomes systemic.
Common LLM Observability Mistakes
Logging only final outputs without prompt context
Aggregating metrics without request-level visibility
Ignoring token truncation
Failing to version prompts
Separating observability logs from evaluation dashboards
Observability fails when it cannot reconstruct a specific event.
Governance Integration
Runtime signals must influence release decisions.
Example triggers:
p99 latency exceeds SLO → investigate routing
Token truncation rate increases → revise context strategy
Tool-call failure spikes → disable workflow
Unexpected routing changes → audit fallback logic
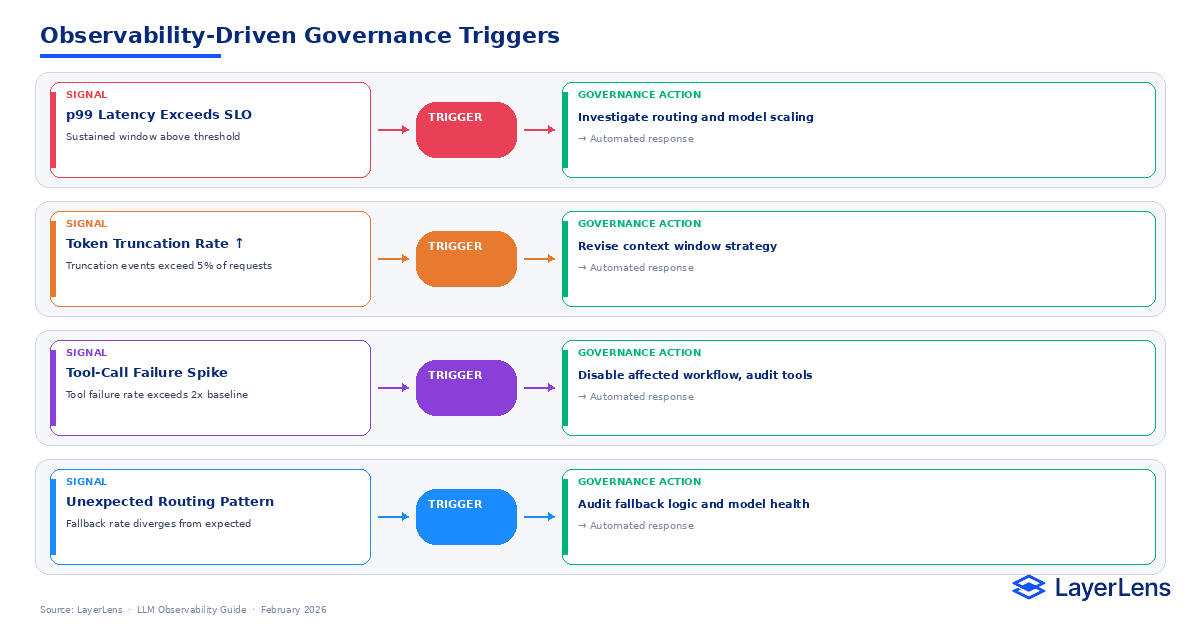
For governance alignment, see the NIST AI Risk Management Framework..
Observability connects runtime evidence to deployment authority.
Conclusion
LLM observability reconstructs the execution path of production requests.
It captures prompts, context, token behavior, routing decisions, and tool interactions. Evaluation measures correctness. Observability explains behavior.
Production AI systems require both. Without runtime visibility, debugging remains speculative. With structured monitoring, failures become diagnosable and correctable.
Observability transforms runtime behavior into accountable engineering practice.
Key Takeaways
Observability provides trace-level visibility across prompts, tokens, routing, and tools.
Evaluation and observability serve different but complementary roles.
Runtime drift often appears first in latency, token usage, and routing changes.
Prompt-level logging is essential for reproducible debugging.
Observability only delivers value when connected to governance decisions.
Frequently Asked Questions
What is LLM observability?
LLM observability is runtime monitoring of prompts, responses, token usage, routing decisions, and tool calls in production AI systems.
How is observability different from evaluation?
Evaluation measures correctness against benchmarks (LLM Evaluation Metrics: https://layerlens.ai/blog/llm-evaluation-metrics-production). Observability reconstructs runtime behavior for specific requests.
What metrics matter most for LLM monitoring?
Prompt logs, token usage, latency percentiles, routing visibility, and structured error classification.
How do you detect runtime drift?
Monitor shifts in latency, token usage, routing patterns, refusal rates, and tool failures over time.
Why is prompt-level logging critical?
Without storing the exact prompt and context, debugging model behavior becomes speculative and non-reproducible.