
AI Model Comparison in Production
Author:
Jake Meany (Dir. of Marketing, LayerLens)
Last updated:
Published:
AI model comparison in production requires evaluating interacting surfaces, not just benchmark accuracy.
Latency variance, token dynamics, and routing behavior materially change real-world performance.
Leaderboards provide baseline signal but ignore integration constraints and regression risk.
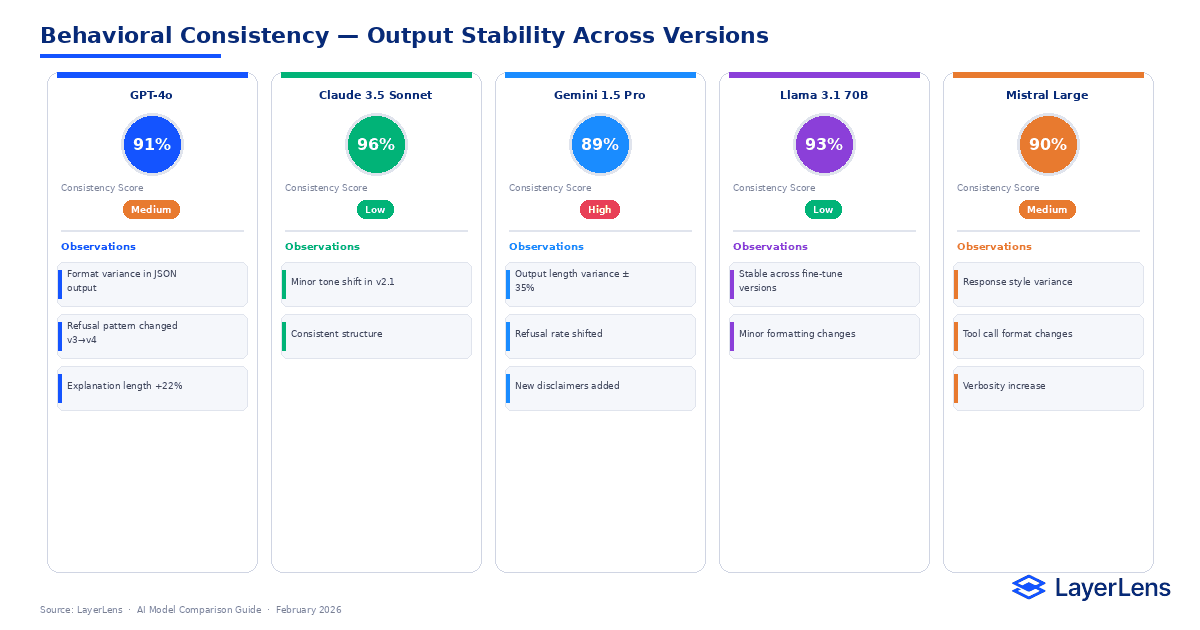
Cost stability and formatting consistency often determine success more than raw accuracy.
Combining llm benchmarking, runtime observability, and regression tracking reduces switching risk.
Model comparison usually starts in a spreadsheet. A few columns, a few deltas, and a decision that appears clean.
Accuracy moves up by two points. Cost per thousand tokens drops slightly. Mean latency remains within budget. On paper, the change looks contained.
What the spreadsheet cannot represent is how those differences interact once the model sits inside your routing logic, your retry thresholds, your prompt templates, and your downstream validators. A small shift in output length can push requests over a latency threshold. A slightly different refusal pattern can cause automated workflows to stall. A marginally more verbose explanation can increase token usage enough to alter cost distribution at scale.
AI model comparison in production rarely fails because the wrong benchmark was consulted. It fails because interaction effects were ignored.
Public leaderboards aggregate performance across standardized tasks (Papers With Code Benchmarks: https://paperswithcode.com/sota). These benchmarks are useful for baseline signal, but they abstract away integration context. They do not account for prompt inflation, structured output contracts, retry loops, or concurrency behavior.
How Does Model Accuracy Change in Production?
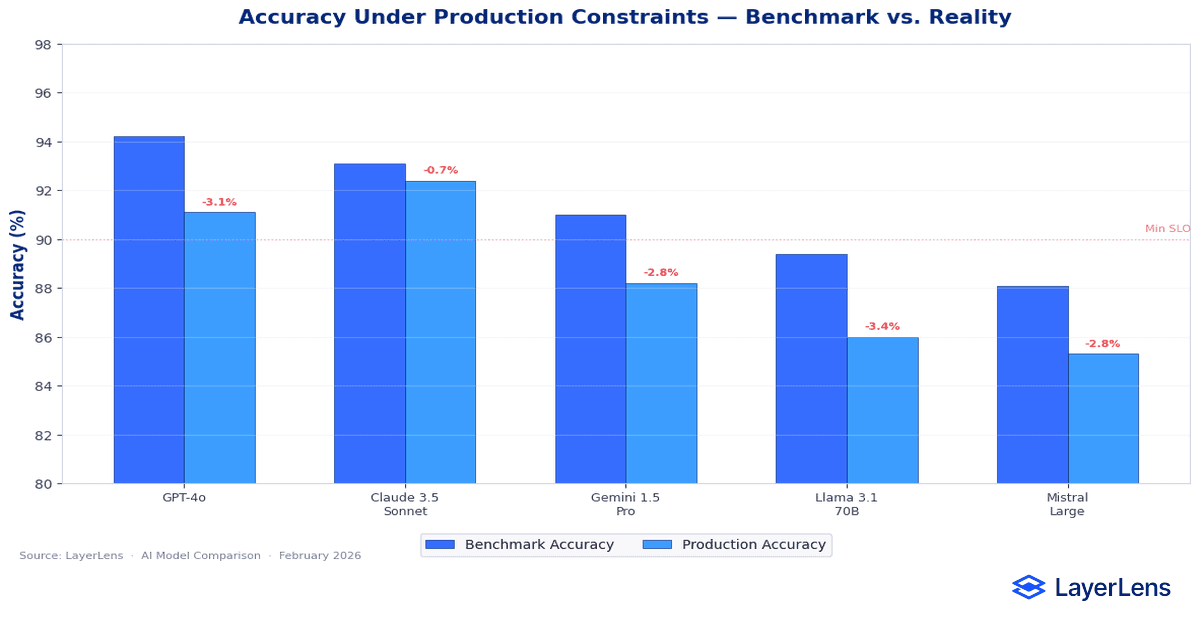
Benchmark accuracy is measured under controlled prompts. Production accuracy is measured under token ceilings, routing policies, concurrency limits, and fallback behavior.
Small deltas on benchmarks such as MMLU (MMLU benchmark results on Papers With Code: https://paperswithcode.com/dataset/mmlu) or HumanEval (HumanEval leaderboard on Papers With Code: https://paperswithcode.com/dataset/humaneval) can disappear once prompts are truncated or routed differently. Accuracy must be tested using real prompt templates and traffic simulations, not just benchmark prompts.
Accuracy also interacts with retry logic. A model with slightly higher single-pass accuracy but lower determinism may generate inconsistent outputs that trigger retries. In such systems, effective accuracy per request can decline even if benchmark accuracy is higher.
For structured metric design, see quantitative evaluation metrics for language models (https://layerlens.ai/blog/llm-evaluation-metrics-production).
How Do You Measure LLM Latency for Model Comparison?
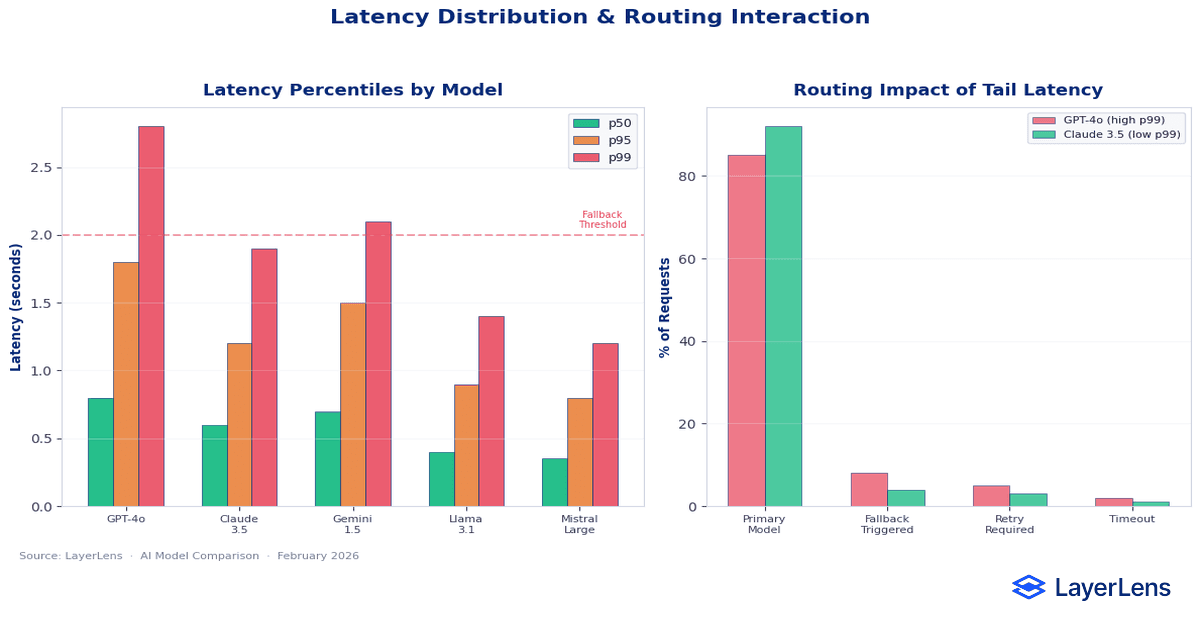
Mean latency hides tail behavior. Production systems are constrained by worst-case scenarios, not averages.
p95 and p99 latency determine whether downstream systems block, retry, or fail. In routing architectures, latency spikes trigger fallback models, which changes both cost and output characteristics.
Latency variance can also influence user perception. Slight jitter in response time can cause perceived instability in interactive systems.
You can analyze latency surfaces across models using LayerLens model comparison tools (https://app.layerlens.ai/comparison), which expose latency distributions rather than single averages.
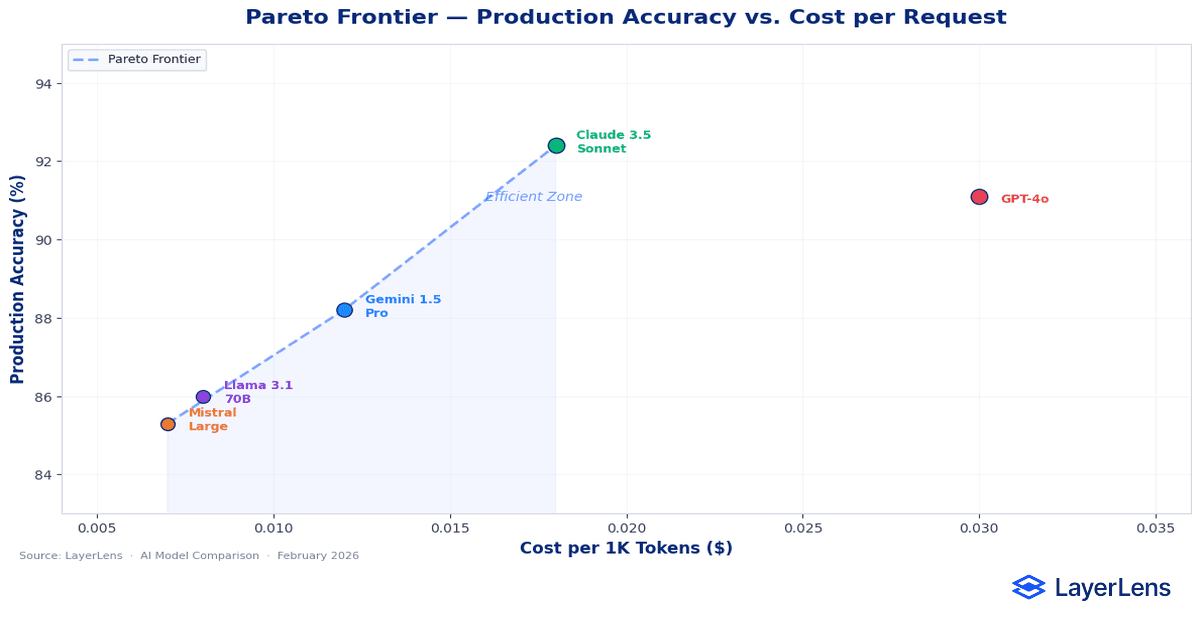
How Do You Compare AI Model Cost vs Performance?
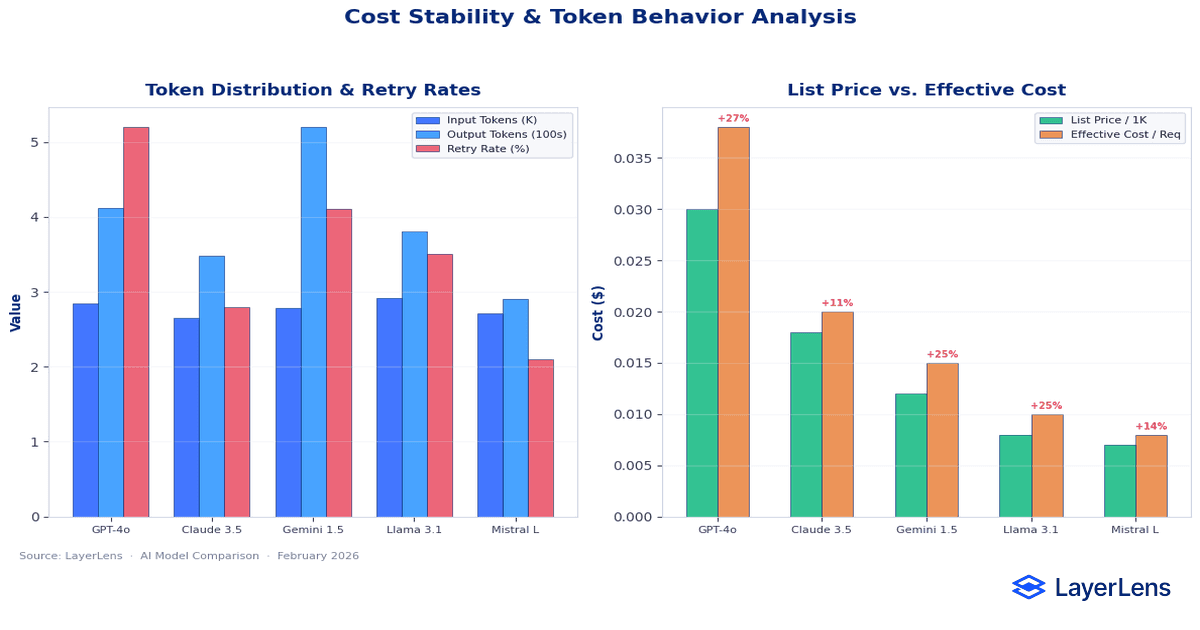
Cost-per-token is not the same as cost-per-successful request.
Token expansion caused by prompt updates can materially change cost. A model that appears inexpensive per token may generate higher aggregate cost due to verbosity. If retries increase due to formatting variance, effective cost rises further.
This is where llm api pricing comparison becomes practical. Pricing needs to be evaluated alongside token distribution, retry frequency, and routing fallbacks. A cheaper model can become more expensive if it triggers retries or requires escalation to higher-cost fallbacks.
For runtime token analysis and tracing, see runtime observability and monitoring for LLM systems (https://layerlens.ai/blog/llm-observability).
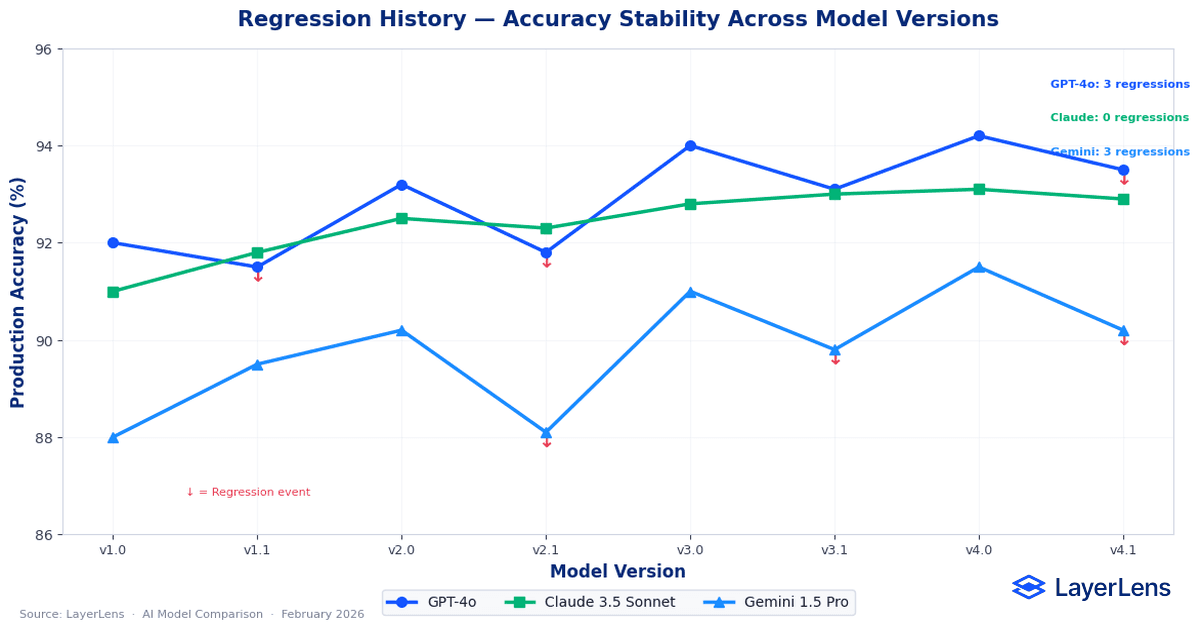
How Do You Detect Regressions When Switching AI Models?
Regression risk is rarely visible in a single benchmark run.
Regressions emerge from distribution shift, prompt template drift, routing changes, and version updates. Research on benchmark saturation effects (https://arxiv.org/abs/2308.02014) highlights how models can appear stable on common benchmarks while degrading on less-represented inputs.
Practical regression detection requires:
Historical benchmark tracking across versions
A holdout dataset sampled from production distribution
Runtime monitoring for latency, refusal rates, truncation rates, and tool failures
LayerLens benchmark history supports cross-version benchmarking (LayerLens benchmark coverage: https://app.layerlens.ai/benchmarks). For governance alignment of regression thresholds, see structured evaluation frameworks for production AI (https://layerlens.ai/blog/llm-evaluation-framework).
What Does an LLM Evaluation Pipeline Look Like?
A production evaluation pipeline combines benchmarking, observability, and governance.
Benchmarks provide comparative signal across models. Observability captures runtime behavior under real traffic. Governance defines how metric violations trigger deployment control.
For the baseline metric taxonomy used in pipelines, see quantitative evaluation metrics for language models. For deployment gating and governance structure, see the LLM evaluation framework guide. For retrieval-specific evaluation pipelines, see the RAG evaluation framework. For adversarial regression testing, see AI red teaming for LLMs.
How Do You Integrate Model Comparison Into Team Workflows?
Model comparison becomes durable when it is treated as an operational workflow, not a one-time selection event.
Engineering needs reproducible evaluations, version tracking, and runtime traces. Product needs constraint clarity (latency, cost, refusal behavior). Operations needs alert thresholds and rollback criteria.
Teams that integrate comparison into release cycles avoid “benchmarked once, shipped forever” dynamics.
LayerLens evaluation dashboards provide the surface for comparing releases and monitoring runtime signals (LayerLens evaluation dashboards: https://app.layerlens.ai/evaluations).
Which AI Model Comparison Tools Should You Use?
Most “ai model comparison” SERPs are dominated by interactive tools and routers. The practical question for teams is which tools support production constraints.
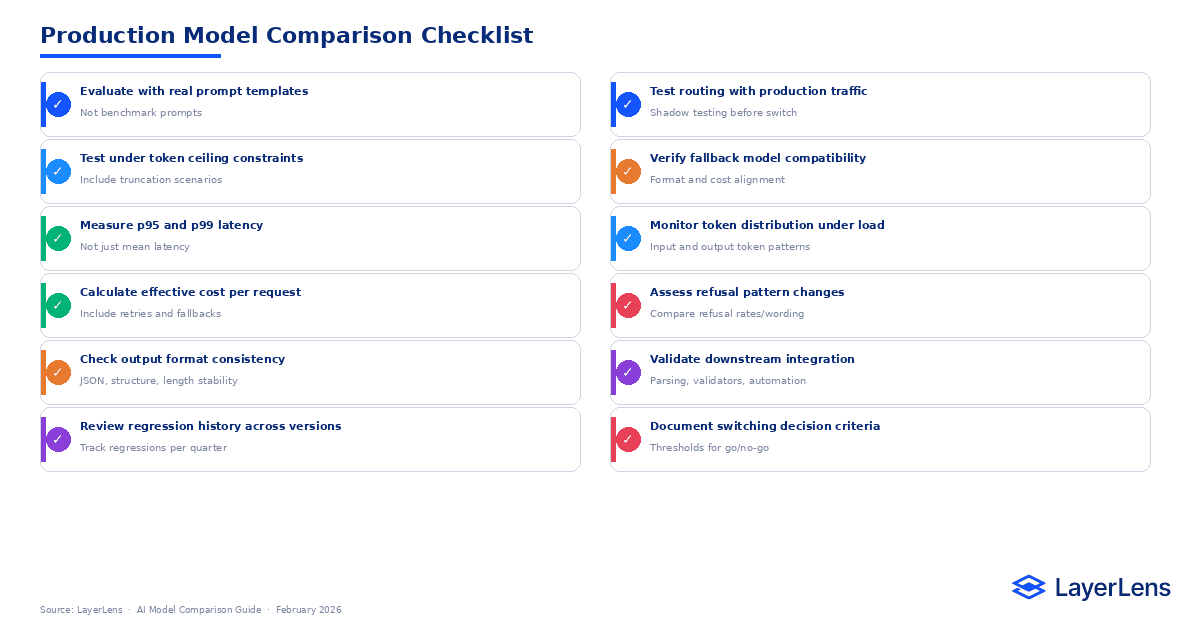
A useful tool should provide:
Model-level benchmarking across tasks
Latency percentile visibility
Token cost and cost-per-request analysis
Regression tracking across versions
Routing and fallback traceability
LayerLens Stratix Premium supports model comparison, private benchmarks, and enterprise dashboards for production monitoring (Stratix Premium monitoring suite: https://layerlens.ai/stratix-premium).
AI Model Comparison Chart
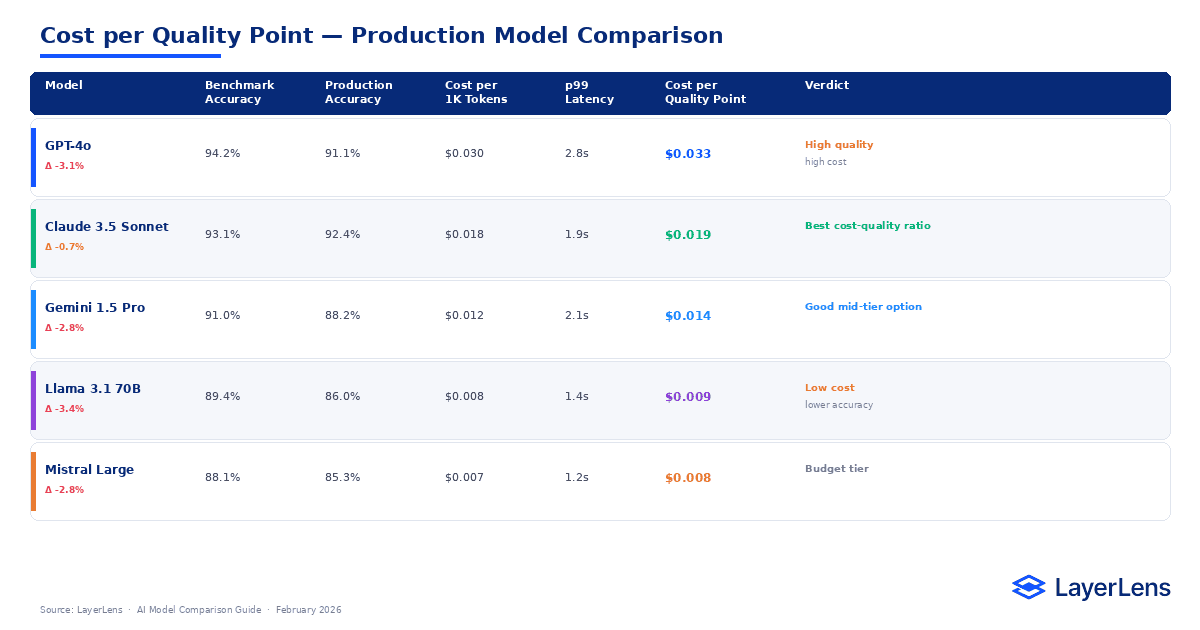
The fastest way to evaluate candidates is to build a structured comparison table that reflects production constraints. This also targets the “ai model comparison chart” query.
This chart should be filled with your own measured values from your evaluation runs. LayerLens comparison tools make it easier to populate this table consistently across candidates (LayerLens model comparison tools: https://app.layerlens.ai/comparison).
Conclusion
Model comparison becomes serious only when the model is embedded in a system.
Before deployment, differences look clean. Accuracy improves. Cost shifts. Latency appears acceptable. After deployment, those same differences are refracted through routing logic, retry thresholds, prompt templates, compliance text, downstream validators, and traffic variance. What looked like a narrow delta becomes a compound effect.
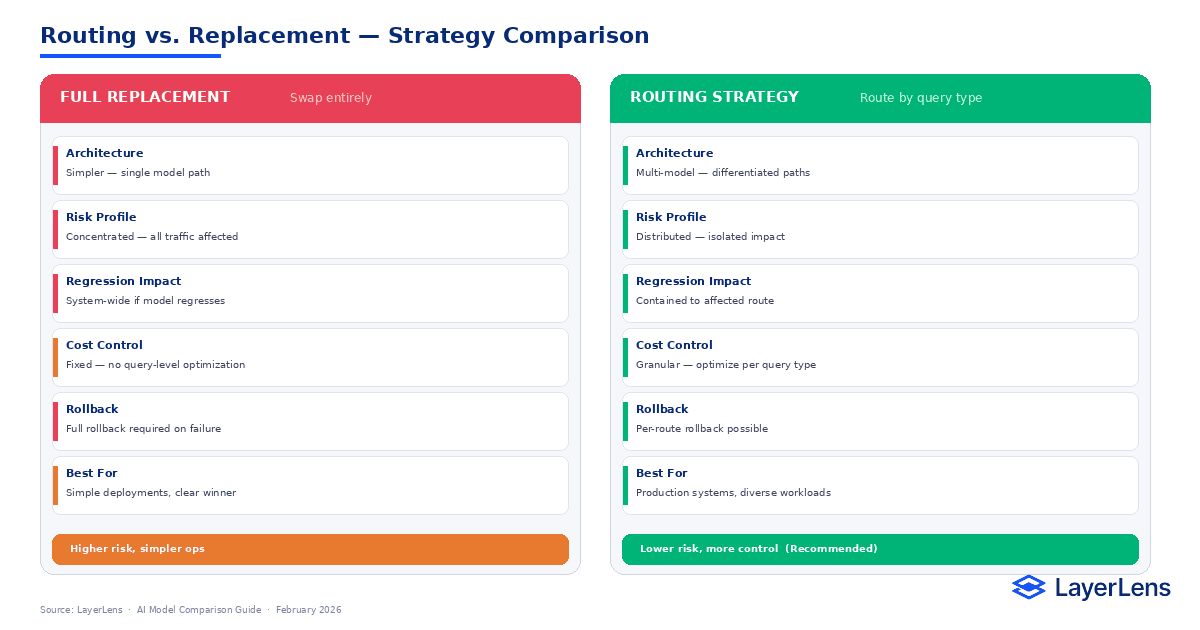
That is why switching models is rarely a pure capability decision. It is an architectural one. A model does not operate in isolation. It interacts with infrastructure assumptions, formatting contracts, cost ceilings, and operational safeguards. A small behavioral change at the model layer can ripple across systems that were never designed for variance.
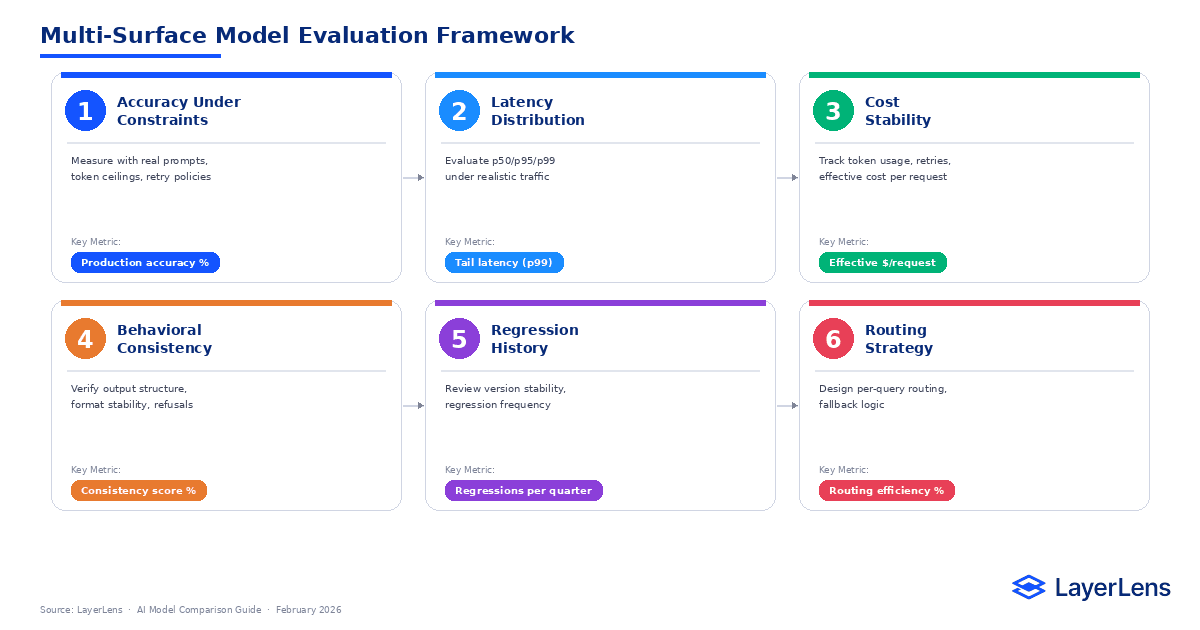
Effective AI model comparison requires stepping back from rankings and examining those interaction points deliberately. Accuracy under constraint. Tail latency under load. Token behavior under real prompts. Consistency across repeated runs. Stability across versions. When those surfaces are evaluated together, switching becomes a controlled engineering decision rather than a reactive upgrade.
The objective is not to chase the highest benchmark score. It is to preserve system stability while improving capability. That tradeoff is rarely visible in a spreadsheet, but it is always visible in production.
Key Takeaways
AI model comparison becomes reliable when evaluated under production constraints.
LLM benchmarking should include latency percentiles, token distributions, and retry behavior.
Cost analysis should model cost per successful request, not just token prices.
Regression risk requires historical tracking and runtime monitoring.
Comparison charts and structured tables increase clarity and reduce decision noise.
Frequently Asked Questions
What is AI model comparison in production?
AI model comparison in production evaluates models across interacting surfaces including accuracy under constraints, latency distribution, cost stability, output consistency, and regression history rather than relying solely on benchmark rankings.
Why are leaderboards insufficient for model selection?
Leaderboards measure standardized tasks under controlled conditions and do not capture routing logic, retry policies, prompt inflation, structured output contracts, or distribution shift (Papers With Code Benchmarks: https://paperswithcode.com/sota).
How do you benchmark an LLM for model selection?
How to benchmark llm systems starts with task-specific benchmarks, then adds latency percentiles, token usage distribution, and regression tracking. Use the same prompt templates and traffic assumptions you will use in production.
How do you reduce regression risk when switching models?
Combine benchmark comparison, runtime observability (runtime observability and monitoring for LLM systems: https://layerlens.ai/blog/llm-observability), and historical performance tracking across versions before deployment.
What is the best way to compare AI model cost vs performance?
Use a cost-per-successful-request view: token cost plus retries plus fallback routing. A cheaper per-token model can be more expensive operationally if it triggers retries or escalations.