
LLM Cost Optimization: What Actually Drives Production Spend
Author:
Jake Meany (Dir. of Marketing, LayerLens)
Last updated:
Published:

Author Bio
Jake Meany is a digital marketing leader who has built and scaled marketing programs across B2B, Web3, and emerging tech. He holds an M.S. in Digital Social Media from USC Annenberg and leads marketing at LayerLens, the AI evaluation and benchmarking platform.
TL;DR
LLM cost optimization is a systems discipline, not a pricing exercise.
Retry amplification and routing elasticity reshape effective cost per successful output.
Prompt evolution drives token growth quietly over time.
Smaller models can increase operational cost if instability rises.
Monitoring volatility is more important than chasing marginal pricing gains.
Introduction
Most cost conversations start in the wrong place: pricing tables.
Price per thousand tokens. Model tiers. API comparisons.
Those numbers are real, but they do not explain why spend drifts once a system is live.
In production, cost behaves like a byproduct of interaction. Prompt templates expand as edge cases are patched. Retrieval context grows as coverage improves. Retry logic triggers more often under stress. Routing thresholds shift traffic as latency fluctuates. Output length changes as prompts evolve.
None of that appears in a pricing sheet.
LLM cost optimization in production is less about vendor selection and more about understanding how your system behaves under real constraints.
Token Growth Is Usually Incremental
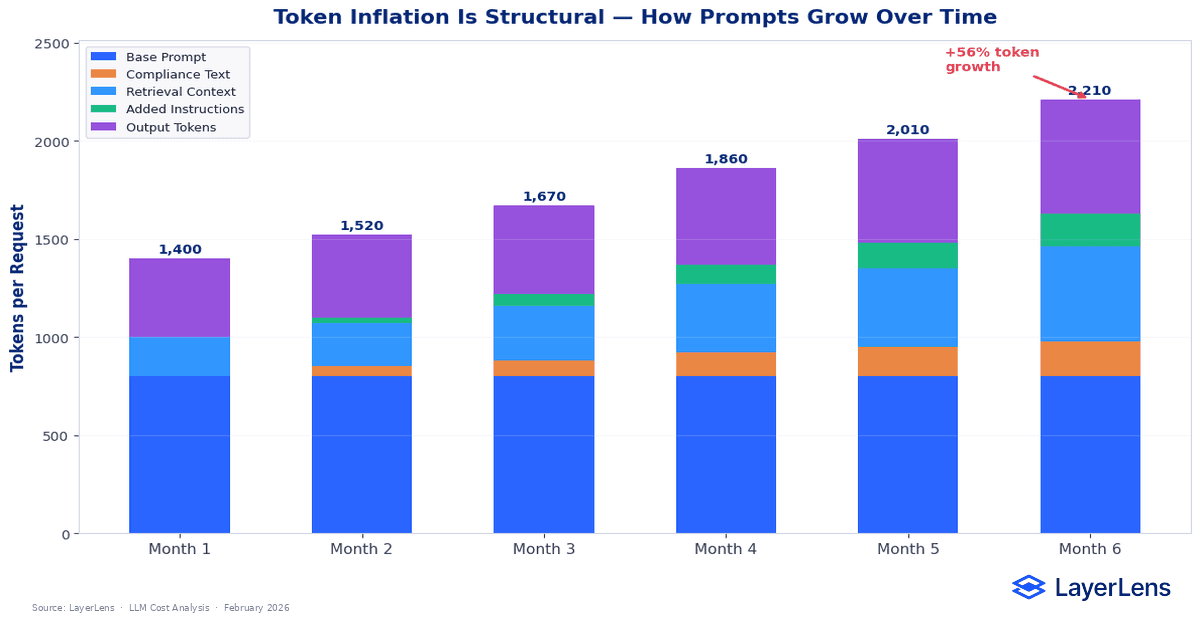
Token inflation rarely arrives as a dramatic spike. It creeps.
A compliance disclaimer adds 80 tokens. A formatting requirement adds 40. Retrieval expands from three documents to five. A safety revision inserts more guardrail language. Each change looks small in isolation.
Six months later, average input length has grown from 900 tokens to 1,450.
At 7.5 million requests per month and $0.012 per 1K tokens, that increase alone adds roughly $49,500 per month. No new features. No pricing changes. Just accumulated adjustments.
Output behavior compounds the effect. Some models elaborate by default. Slight prompt changes increase response length by 10 to 20 %. Over millions of calls, that drift reshapes total llm inference cost.
Token growth is rarely a conscious decision. It is a side effect of maintaining the system.
Tracking token distribution over time, not just total monthly spend, is how you catch it early.
The Retry Multiplier
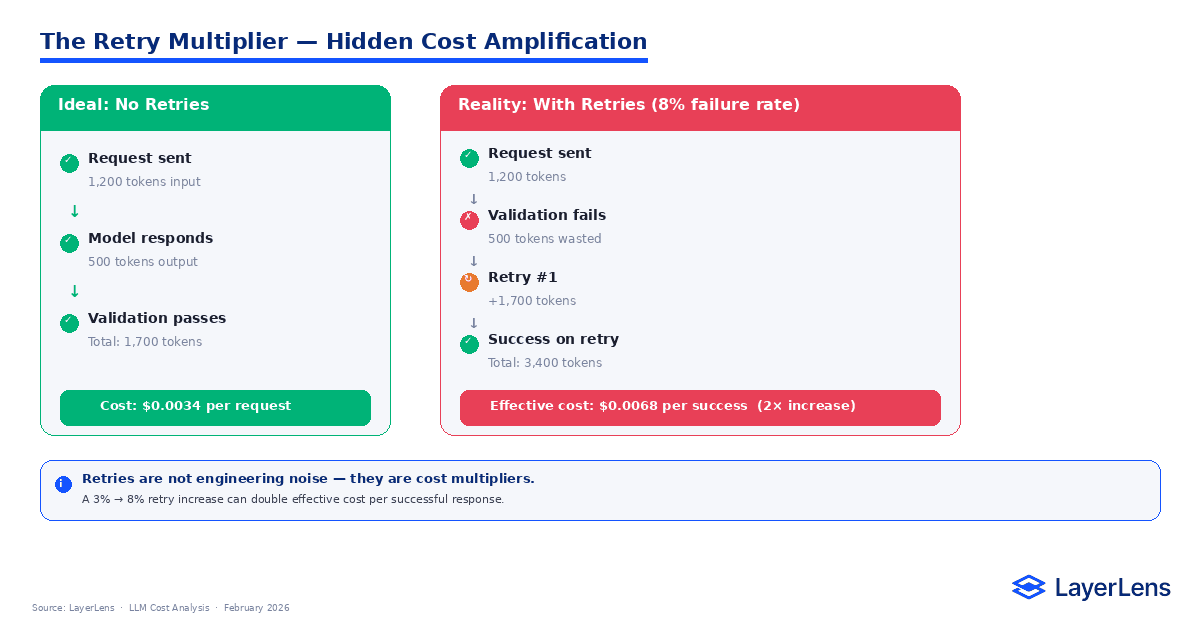
Retries are easy to ignore because they look like edge cases.
A formatting validation failure triggers a second call. A timeout results in regeneration. A downstream parser rejects an output and forces another attempt. Individually, these events are routine.
At scale, they alter cost structure.
A system handling 9 million monthly requests with a 4 % retry rate generates 360,000 additional calls. If a prompt update pushes retry frequency to 9 %, the additional calls more than double. Effective llm api cost rises without any change in user traffic.
Retries also affect routing. Increased latency from repeated attempts can trigger fallback rules that shift traffic toward more expensive models. That interaction amplifies spend further.
Cost per successful completion, not cost per initial request, is the relevant metric.
Retries compound.
Routing Under Load
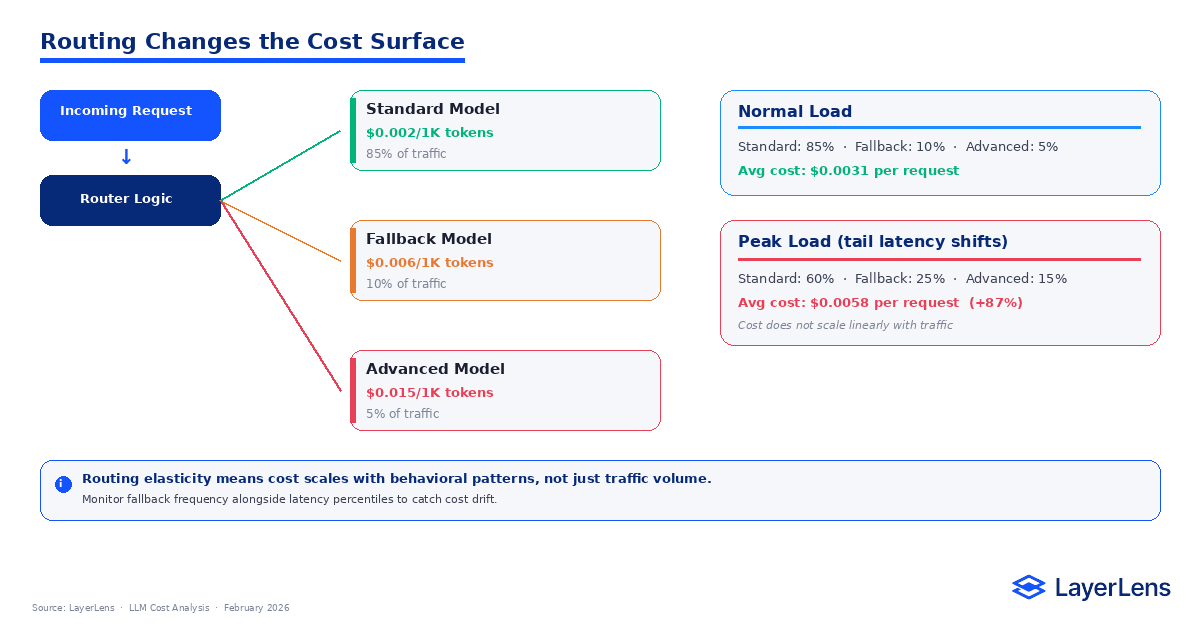
Routing logic keeps systems responsive. It also shifts cost distribution.
Under steady traffic, a system might route 70 % to a mid-tier model and 30 % to a higher-capability model. Under peak concurrency, tail latency increases. Routing rules designed to protect response times begin triggering fallback more often.
If fallback models cost two or three times more per request, even a modest routing shift changes aggregate spend. Traffic volume can remain constant while cost increases.
This is routing elasticity.
You cannot evaluate LLM cost optimization accurately without analyzing routing behavior under load conditions.
Cost scales with system stress, not just request count.
Smaller Does Not Always Mean Cheaper
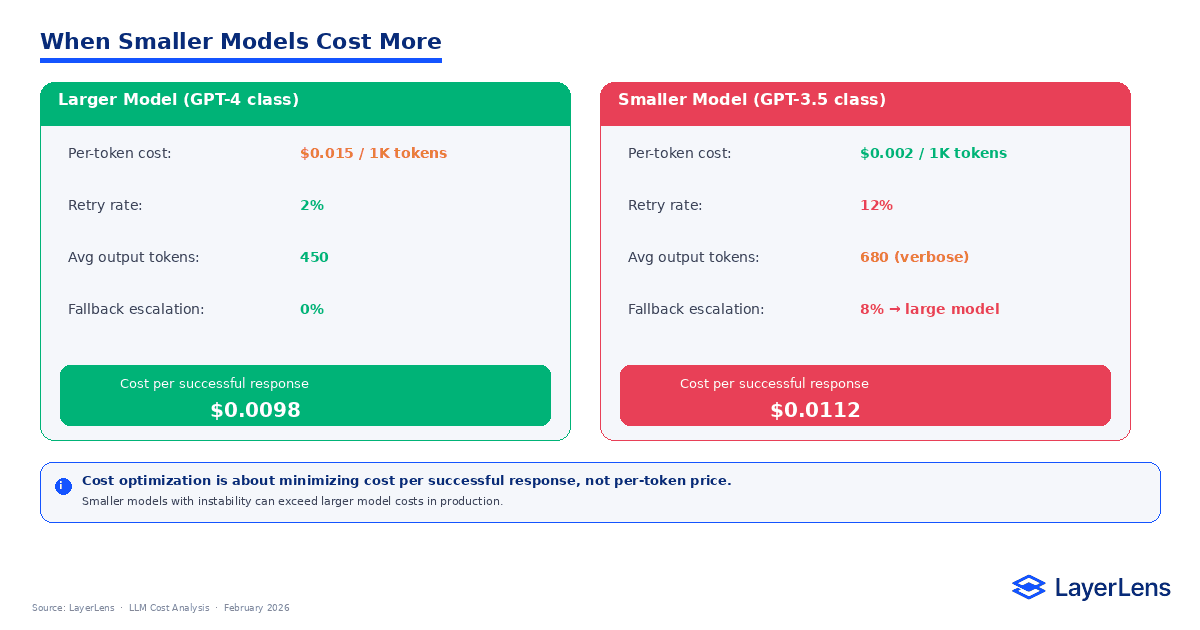
Lower per-token pricing does not guarantee lower operational cost.
A smaller model may require more retries, produce longer explanations, or escalate complex queries to a more capable fallback model. Each of those behaviors increases cost per successful output.
For example, Model A may cost $0.015 per request with a 2 % retry rate. Model B may cost $0.010 per request but require retries 12 % of the time. Once retries and escalations are factored in, Model B can exceed Model A in total spend.
Cost comparison must therefore include stability and retry frequency, not just pricing.
LLM cost management is about reliability as much as it is about price.
Cost Drift Over Time
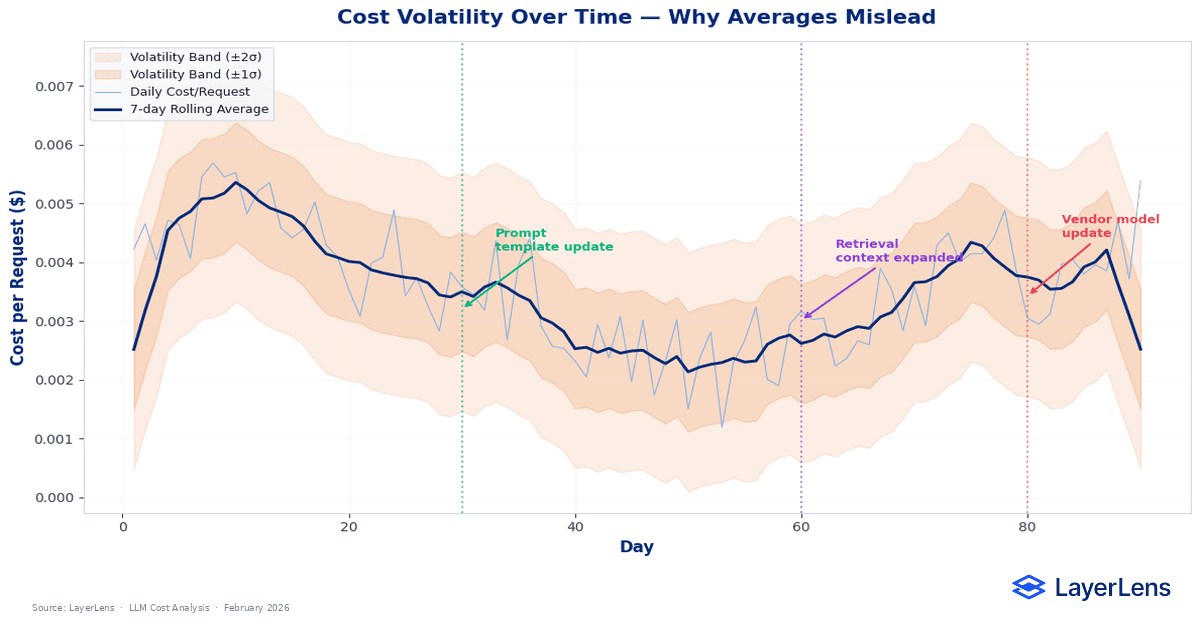
Even if average cost per request appears steady, volatility can increase quietly.
Prompt updates alter token distribution. Traffic gradually skews toward more complex queries. Vendor model updates change verbosity or reasoning patterns without explicit announcements.
A system costing $80,000 per month in January can cost $95,000 in April without any change in pricing or traffic volume. The increase emerges from accumulated behavioral drift.
Monitoring volatility bands, not just monthly totals, is necessary to maintain stability.
Cost stability requires ongoing measurement.
Cost Per Successful Completion
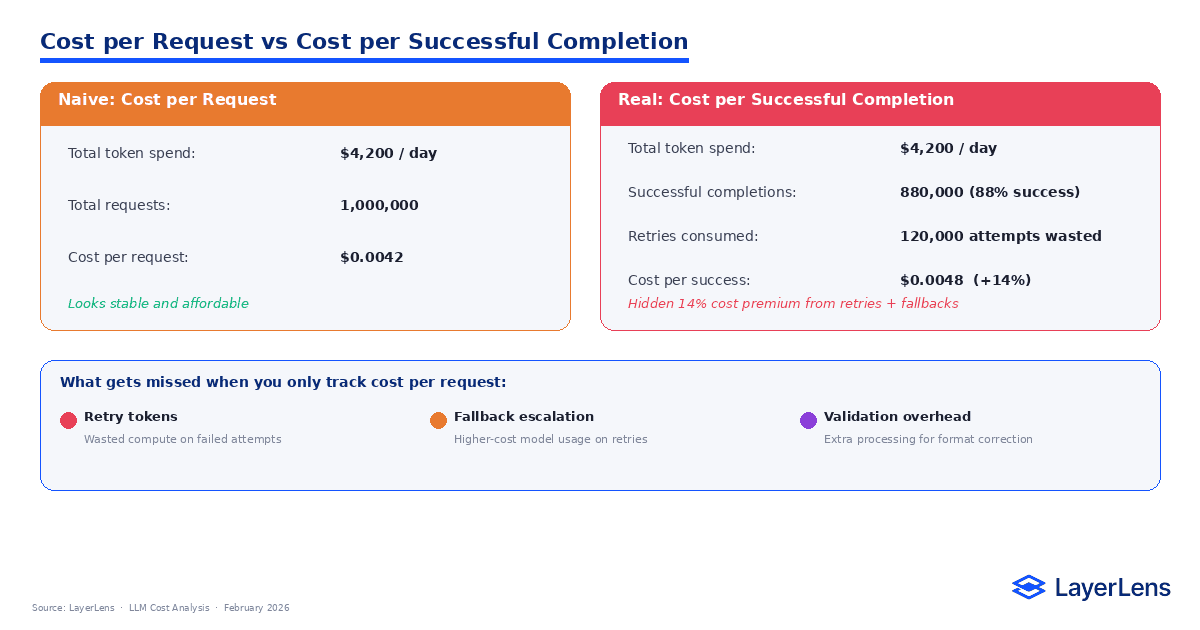
Most dashboards divide spend by request count.
That metric misses the point.
True cost should be divided by successful, validated outputs. If 100 user requests require 112 total attempts to produce 100 valid responses, cost should be calculated against the 100 successful completions.
Including retries, fallback routing, and validation overhead often changes which model appears least expensive.
Cost optimization grounded in cost per successful completion aligns engineering metrics with actual delivered value.
What Actually Reduces LLM Cost
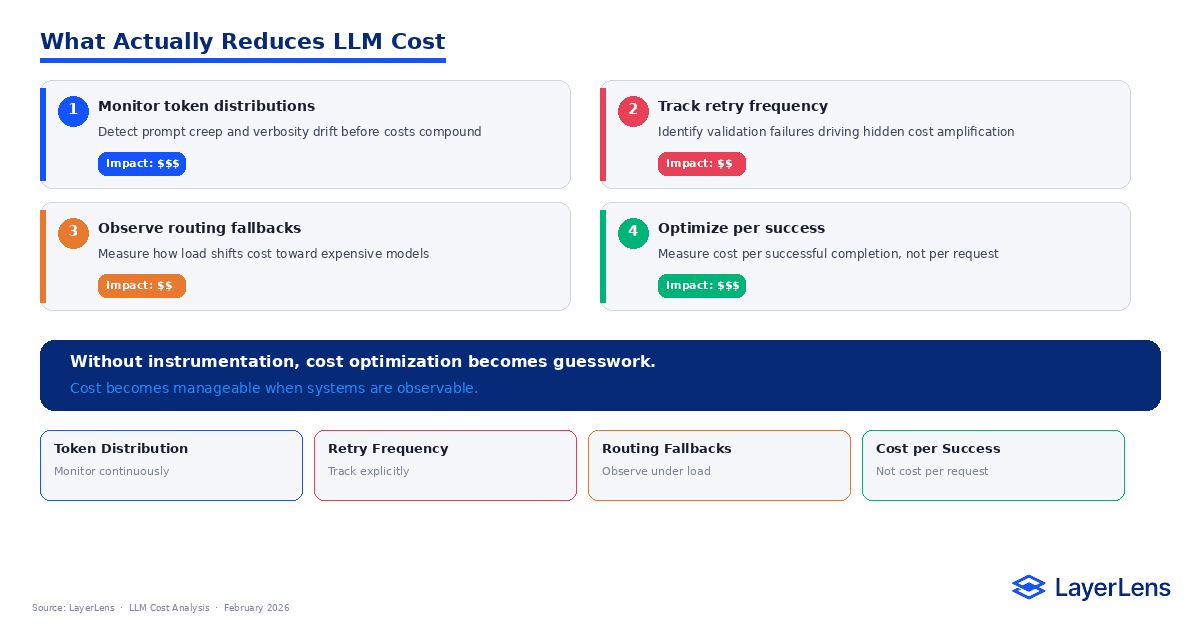
Cost becomes manageable when behavior becomes observable.
Monitoring token distributions reveals prompt creep early. Tracking retry rates highlights instability before it compounds. Observing routing mix under load exposes elasticity that affects spend during peak traffic.
When root causes are identified, interventions are targeted.
Simplify prompt templates to reduce token growth. Tighten output constraints to lower retry frequency. Adjust routing thresholds to stabilize model mix.
Without instrumentation, cost reduction efforts become reactive. With structured monitoring, they become controlled.
Conclusion
Traditional cost conversations focus on pricing.
Production cost is shaped by prompt evolution, retry behavior, routing elasticity, and output drift. These forces accumulate gradually and become visible only at scale.
Teams that focus exclusively on per-token pricing optimize the wrong variable. Teams that monitor behavioral drivers maintain predictable spend.
LLM cost optimization is not about minimizing tokens indiscriminately. It is about keeping cost stable as the system evolves.
Frequently Asked Questions
What drives LLM cost in production?
LLM cost in production is driven by token usage growth, retry frequency, routing fallback behavior, output verbosity drift, and traffic composition changes. Pricing per 1K tokens is only one variable in a much larger system dynamic.
How do retries affect LLM cost?
Retries increase cost because failed attempts consume tokens without delivering usable output. When retry rates increase from 3 % to 8 %, effective cost per successful completion can rise materially even if traffic volume stays constant.
What is cost per successful completion?
Cost per successful completion divides total spend by validated outputs, not by initial requests. It accounts for retries, fallback routing, and validation overhead, providing a more accurate measure of real operational cost.
Why can smaller models cost more?
Smaller models can cost more when instability increases retry rates, verbosity expands output tokens, or fallback escalation shifts traffic to higher-cost models. Operational stability often matters more than nominal per-token pricing.
How can teams reduce LLM costs effectively?
Teams reduce LLM costs by monitoring token distribution, retry frequency, routing ratios, and regression trends. Addressing root behavioral drivers is more effective than switching providers based solely on pricing comparisons.
Key Takeaways
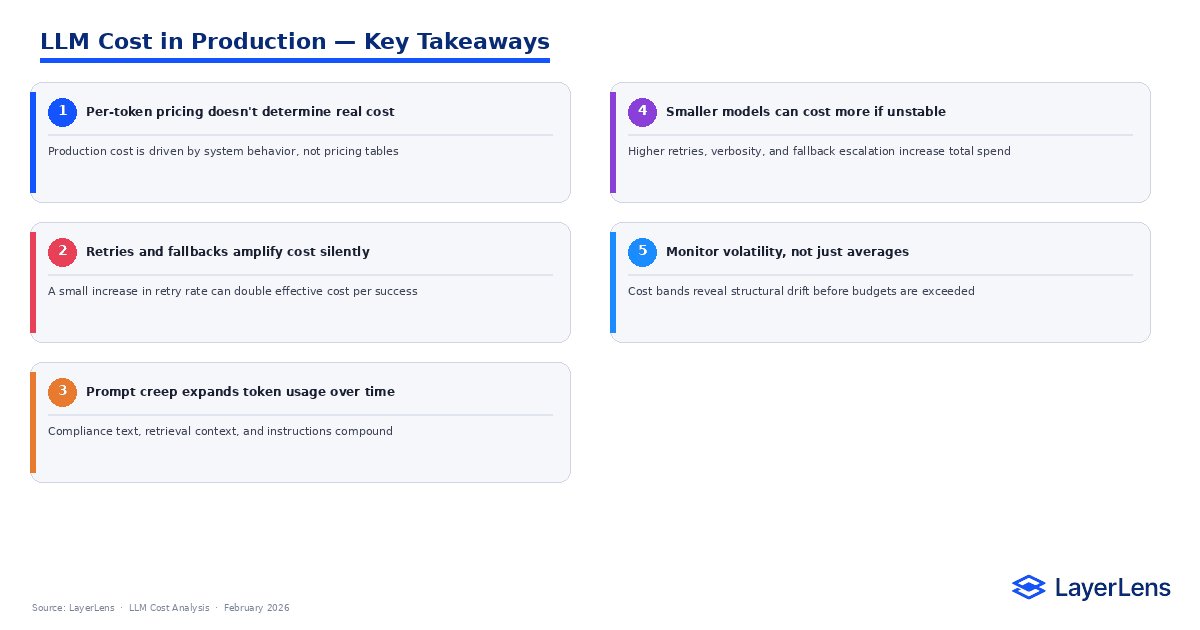
LLM cost optimization depends on managing system behavior, not negotiating marginal pricing.
Retry amplification increases cost per successful output and compounds under load.
Prompt creep drives long-term token growth even when traffic stays flat.
Routing elasticity reshapes spend during peak concurrency windows.
Monitoring volatility bands prevents silent budget drift over time.