
LLM Evaluation Framework for Production
Author:
LayerLens Research
Last updated:
Published:
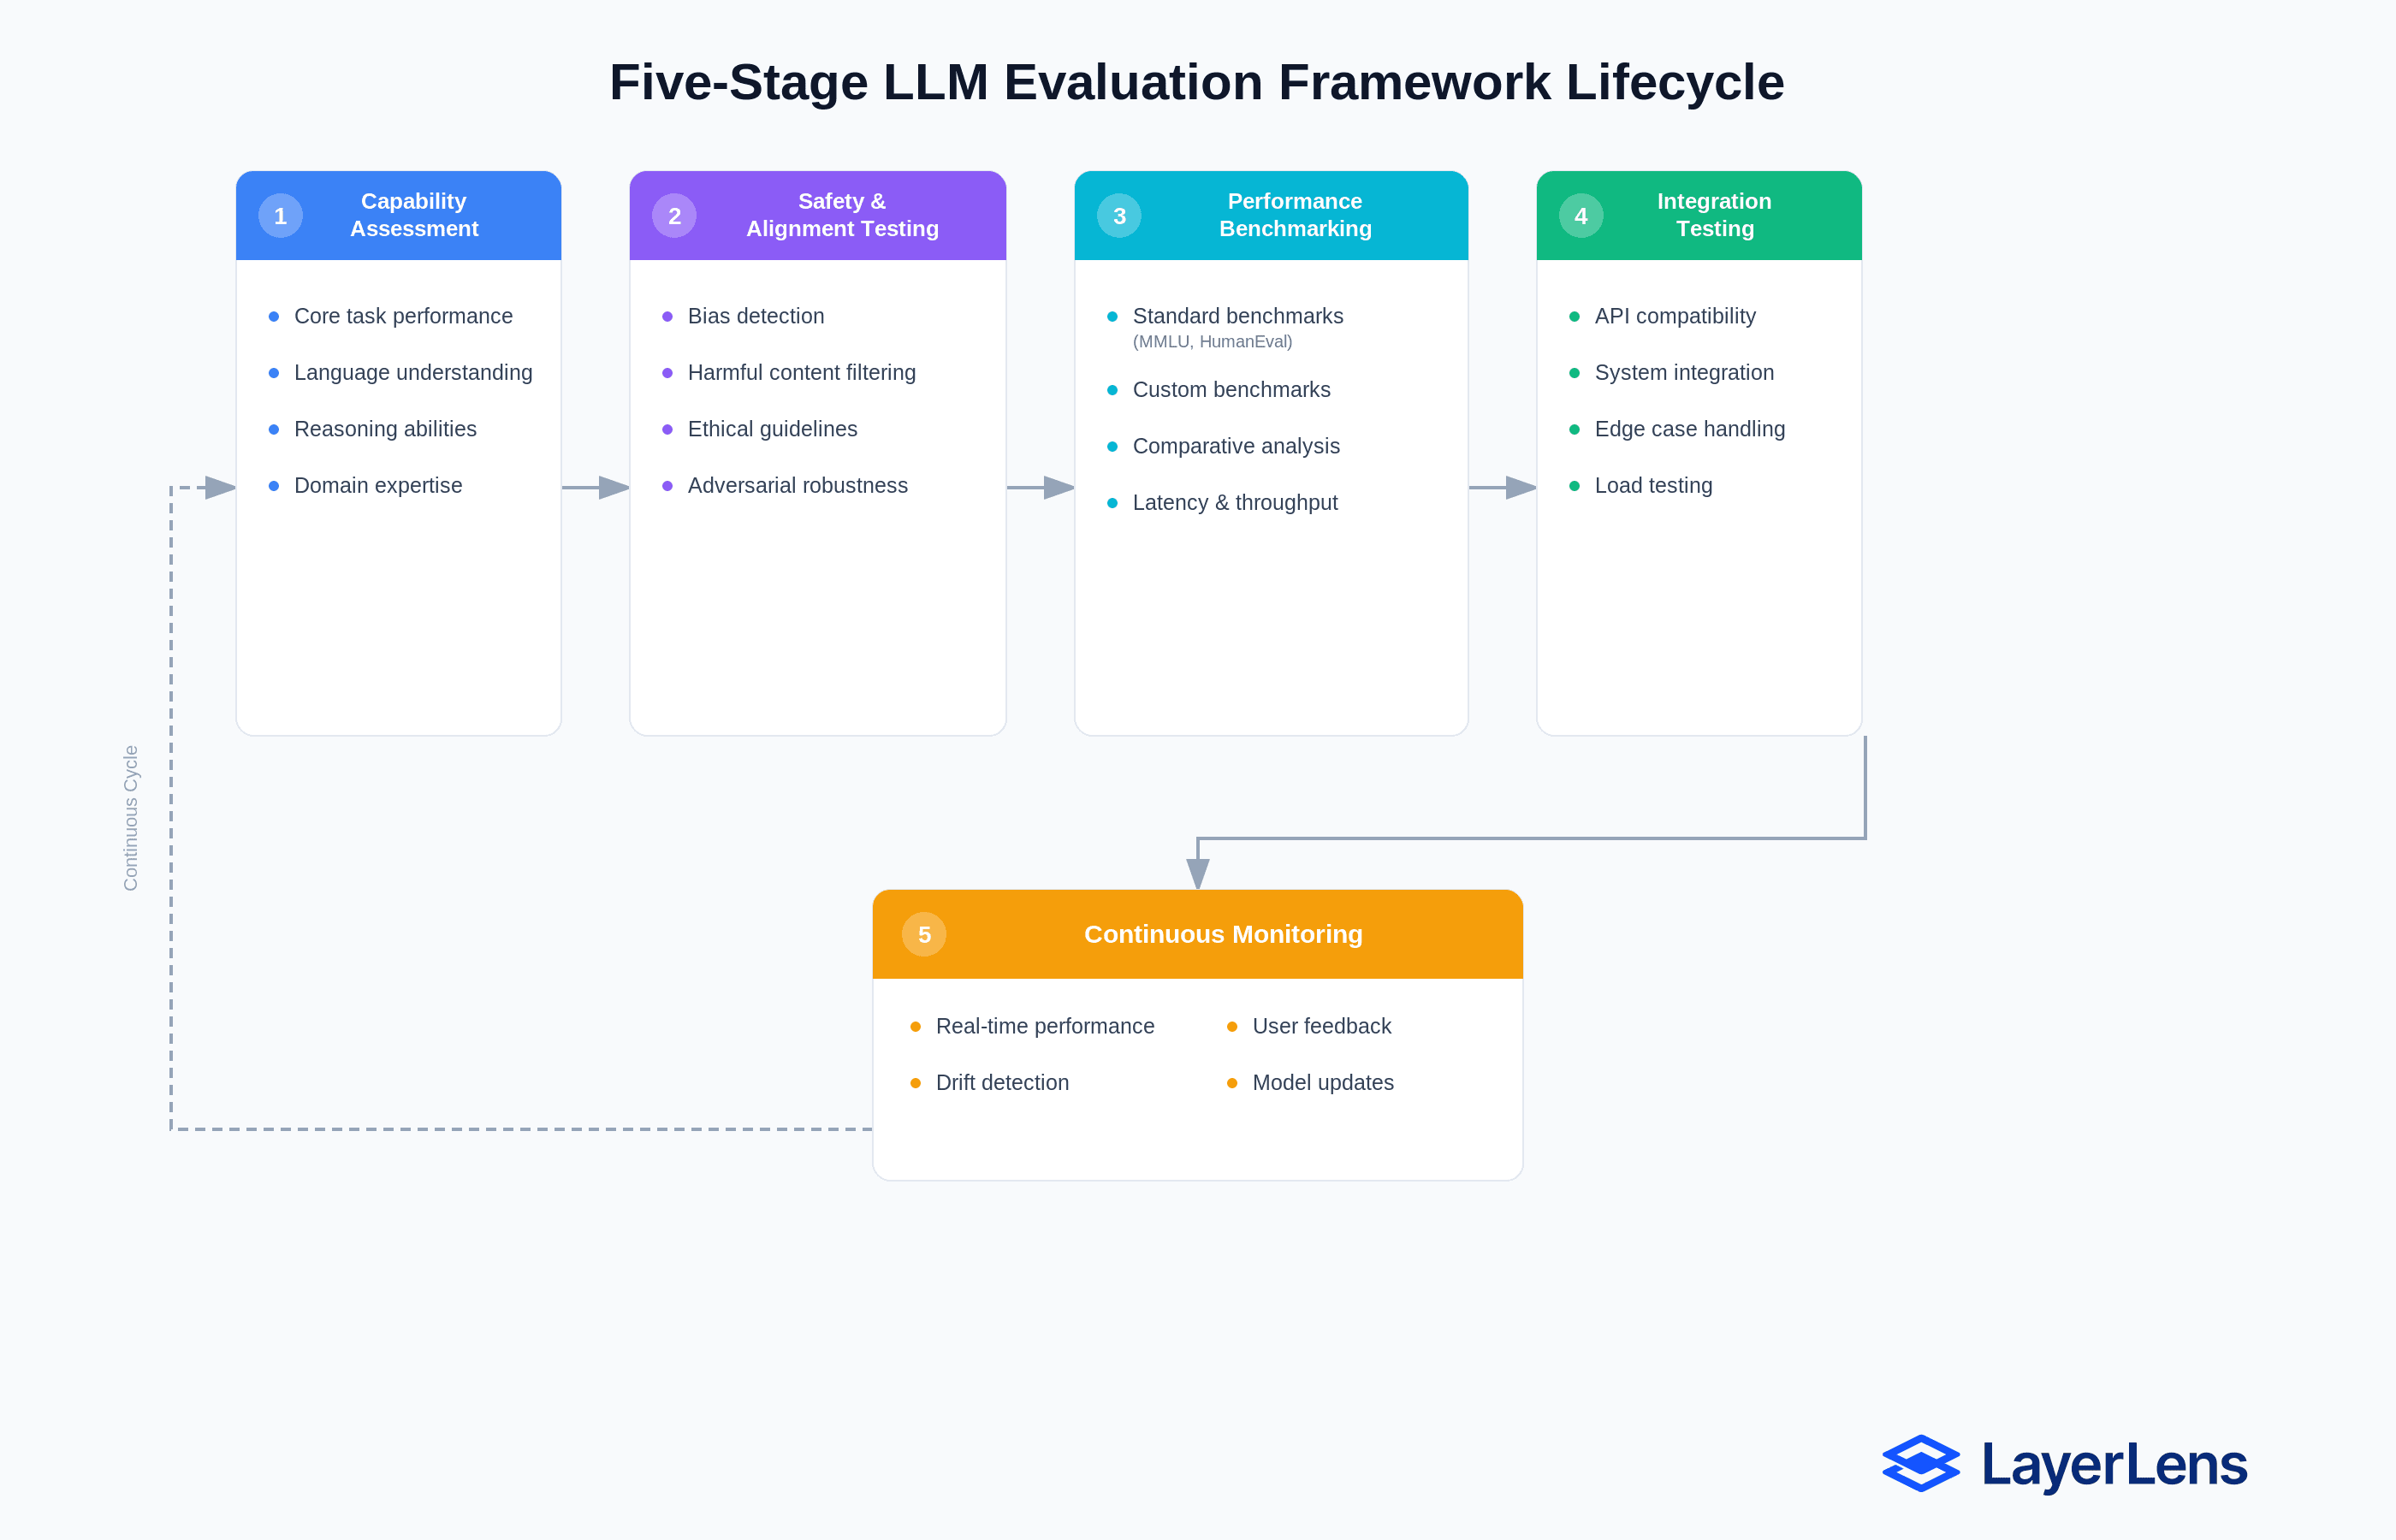
The five-stage LLM evaluation framework lifecycle.
An LLM evaluation framework is a structured system for measuring model performance across accuracy, safety, latency, cost, and robustness before and after deployment.
Static benchmark scores do not predict production reliability under distribution shift.
Production-grade evaluation requires pre-deployment gating, shadow deployment, continuous monitoring, drift detection, and governance tied directly to deployment decisions.
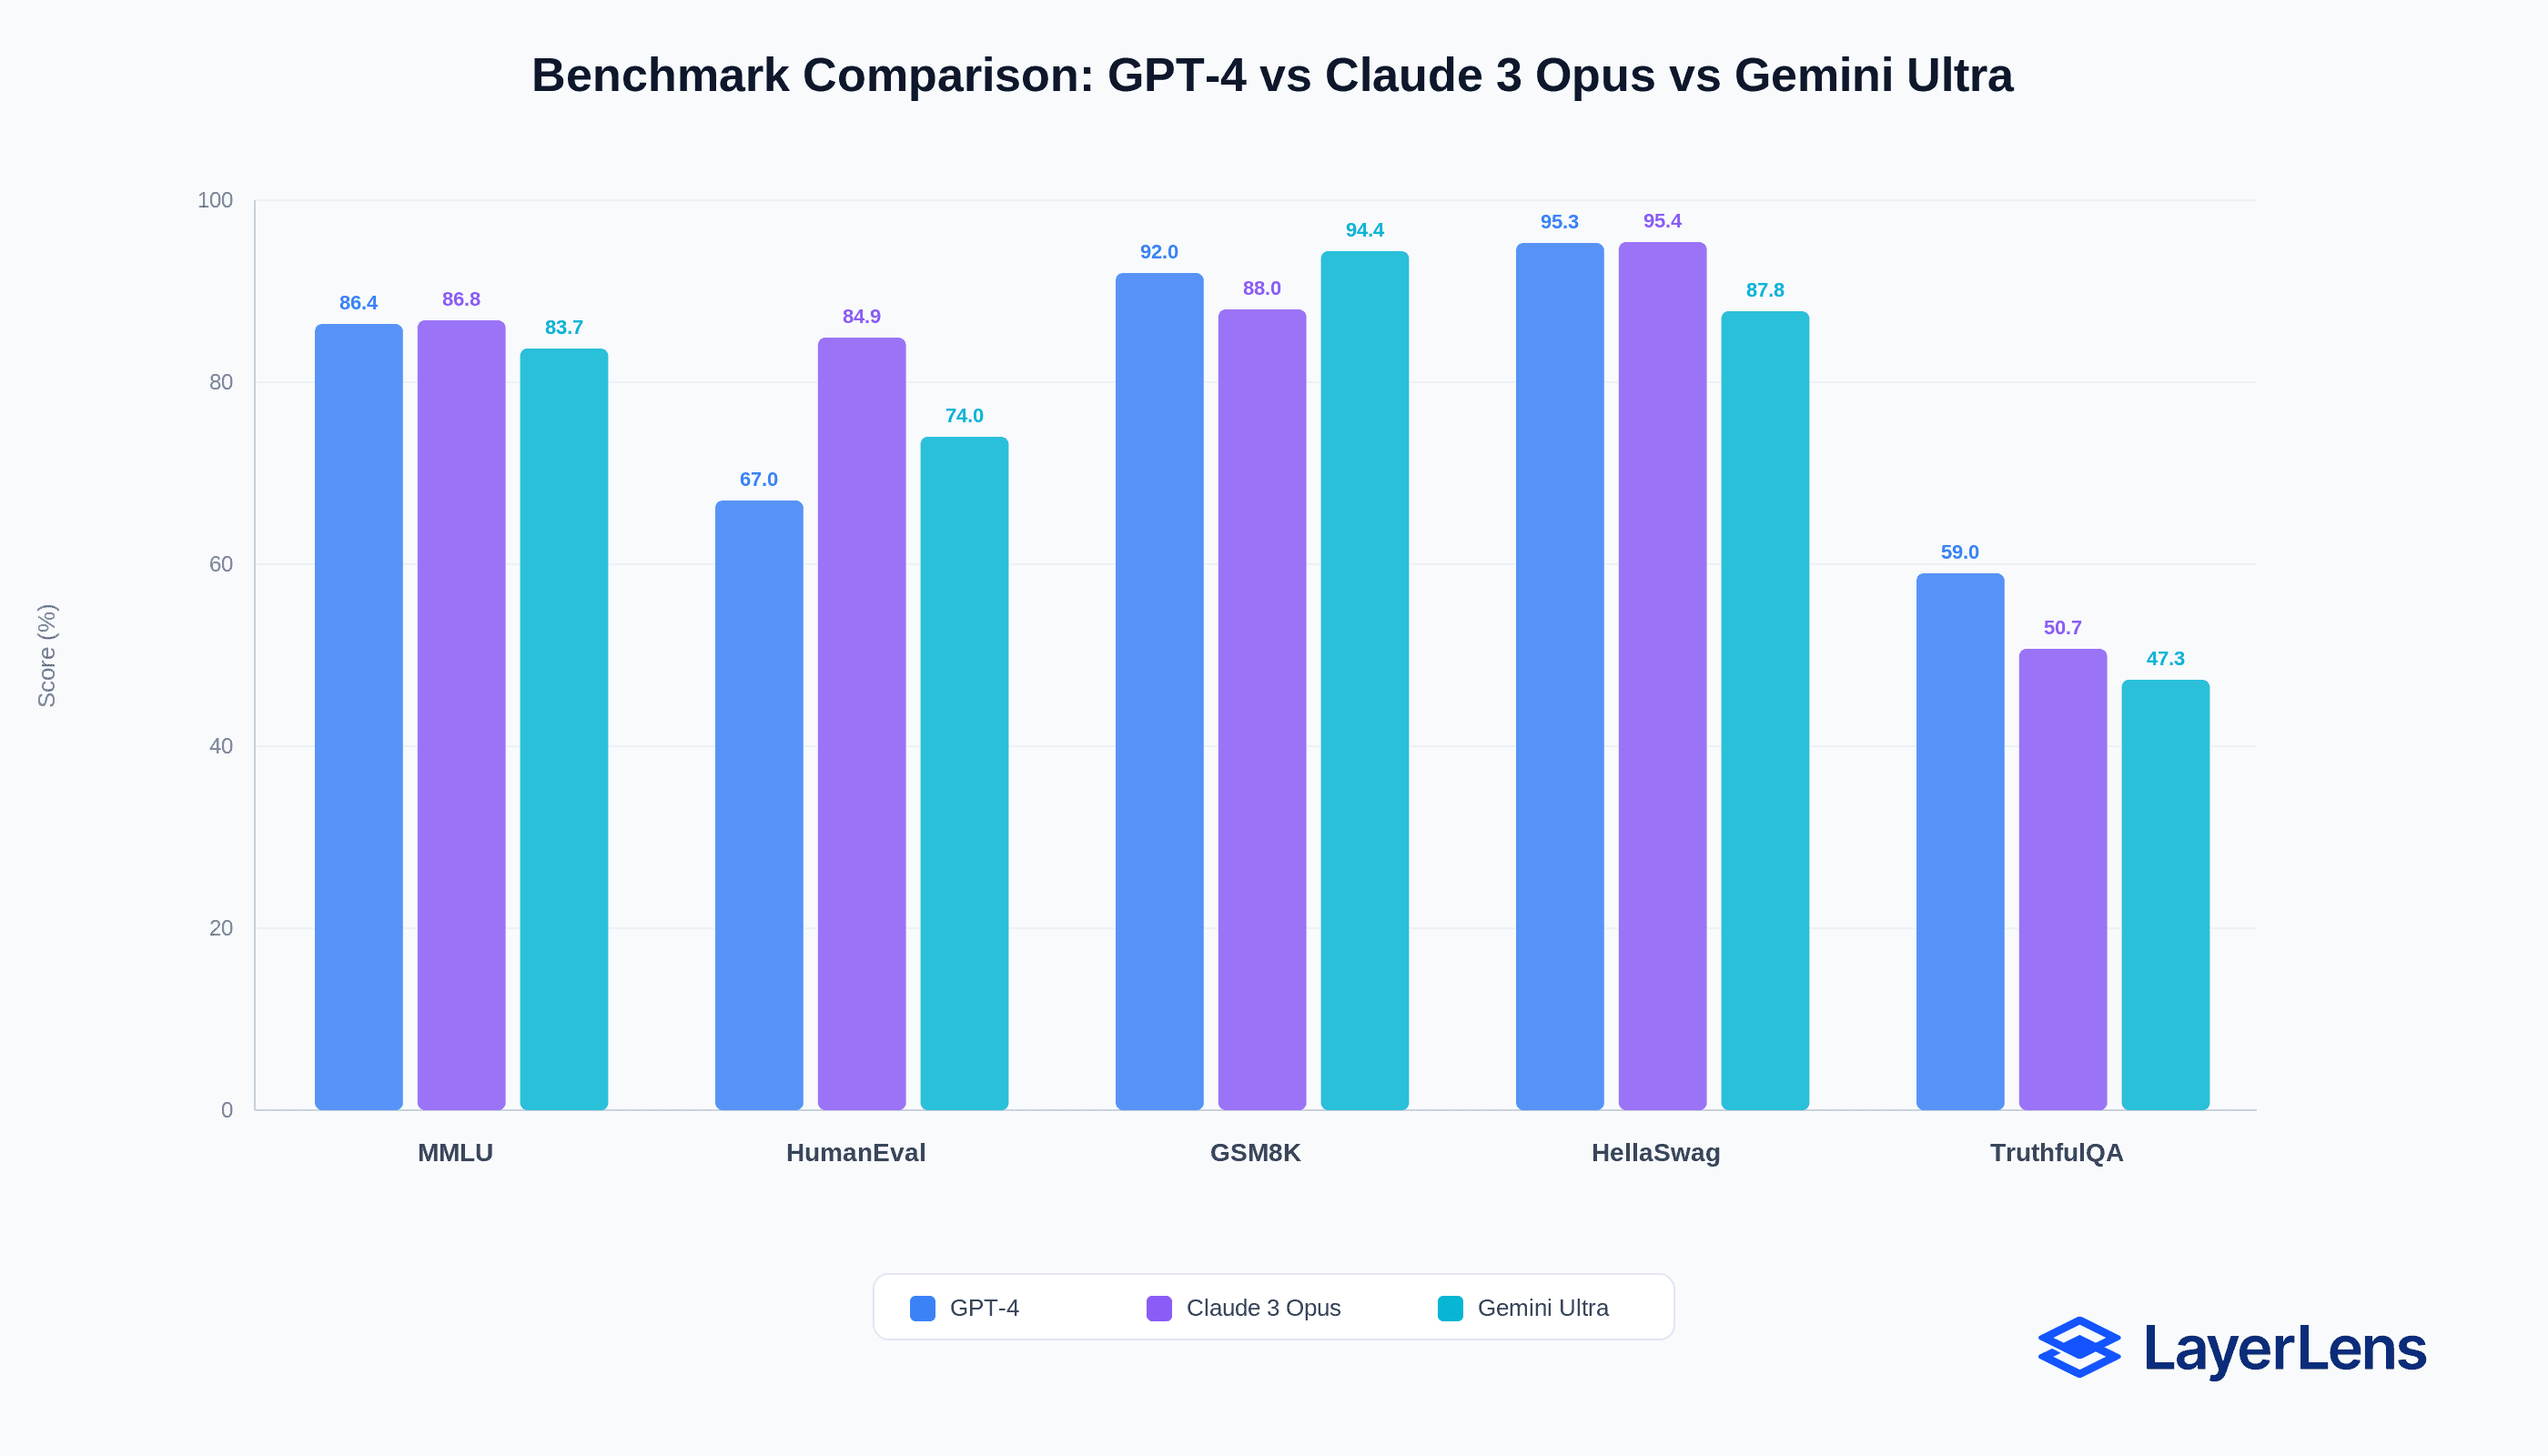
A model scores 96.60% on MATH-500. The same model scores 13.59% on Humanity’s Last Exam. That 83-point gap explains why an LLM evaluation framework must extend beyond static benchmarks.
Across more than 2,000 evaluation runs and 200+ benchmarks in the LayerLens system, performance variance across tasks is consistent.
A benchmark measures performance on a fixed dataset. Production systems introduce distribution shift, adversarial prompting, workload variability, and infrastructure constraints.
What Is an LLM Evaluation Framework?
LLM benchmark scores fail in production for three reasons: benchmark saturation, task misalignment, and preference distortion.
Benchmark saturation: frontier models cluster above 90% on many academic benchmarks.
Task misalignment: MMLU measures multiple-choice reasoning. Production workloads activate different capability surfaces.
Preference distortion: human preference does not equal factual correctness.
Composite leaderboards compress multi-dimensional behavior into a single score.
How Do You Evaluate LLMs in Production?
Evaluating LLMs in production requires five stages:
1. Pre-Deployment Gating
Evaluate task-specific benchmarks aligned to your workload.
Summarization → summarization benchmarks
SQL generation → constraint violation testing
RAG systems → retrieval + faithfulness
Pair task accuracy with safety latency (p95, p99), and cost profiling.
Use structured comparison dashboards.
Define thresholds:
Accuracy ≥ 90%
Harmful output ≤ 1%
p95 latency ≤ 2 seconds
2. What Is Shadow Deployment?
Shadow deployment runs a candidate model on live traffic without serving responses to users.
It establishes real-world baselines and exposes distribution shift.
3. Continuous Evaluation
Run automated scoring on production traffic.
Sample responses for deep evaluation using LLM-as-judge methodologies.
Evaluation becomes continuous infrastructure
4. How Do You Detect LLM Drift?
Monitor statistical changes in accuracy, safety, latency, and cost.
Use thresholds to trigger investigation.
Drift may reflect distribution shift or degradation.
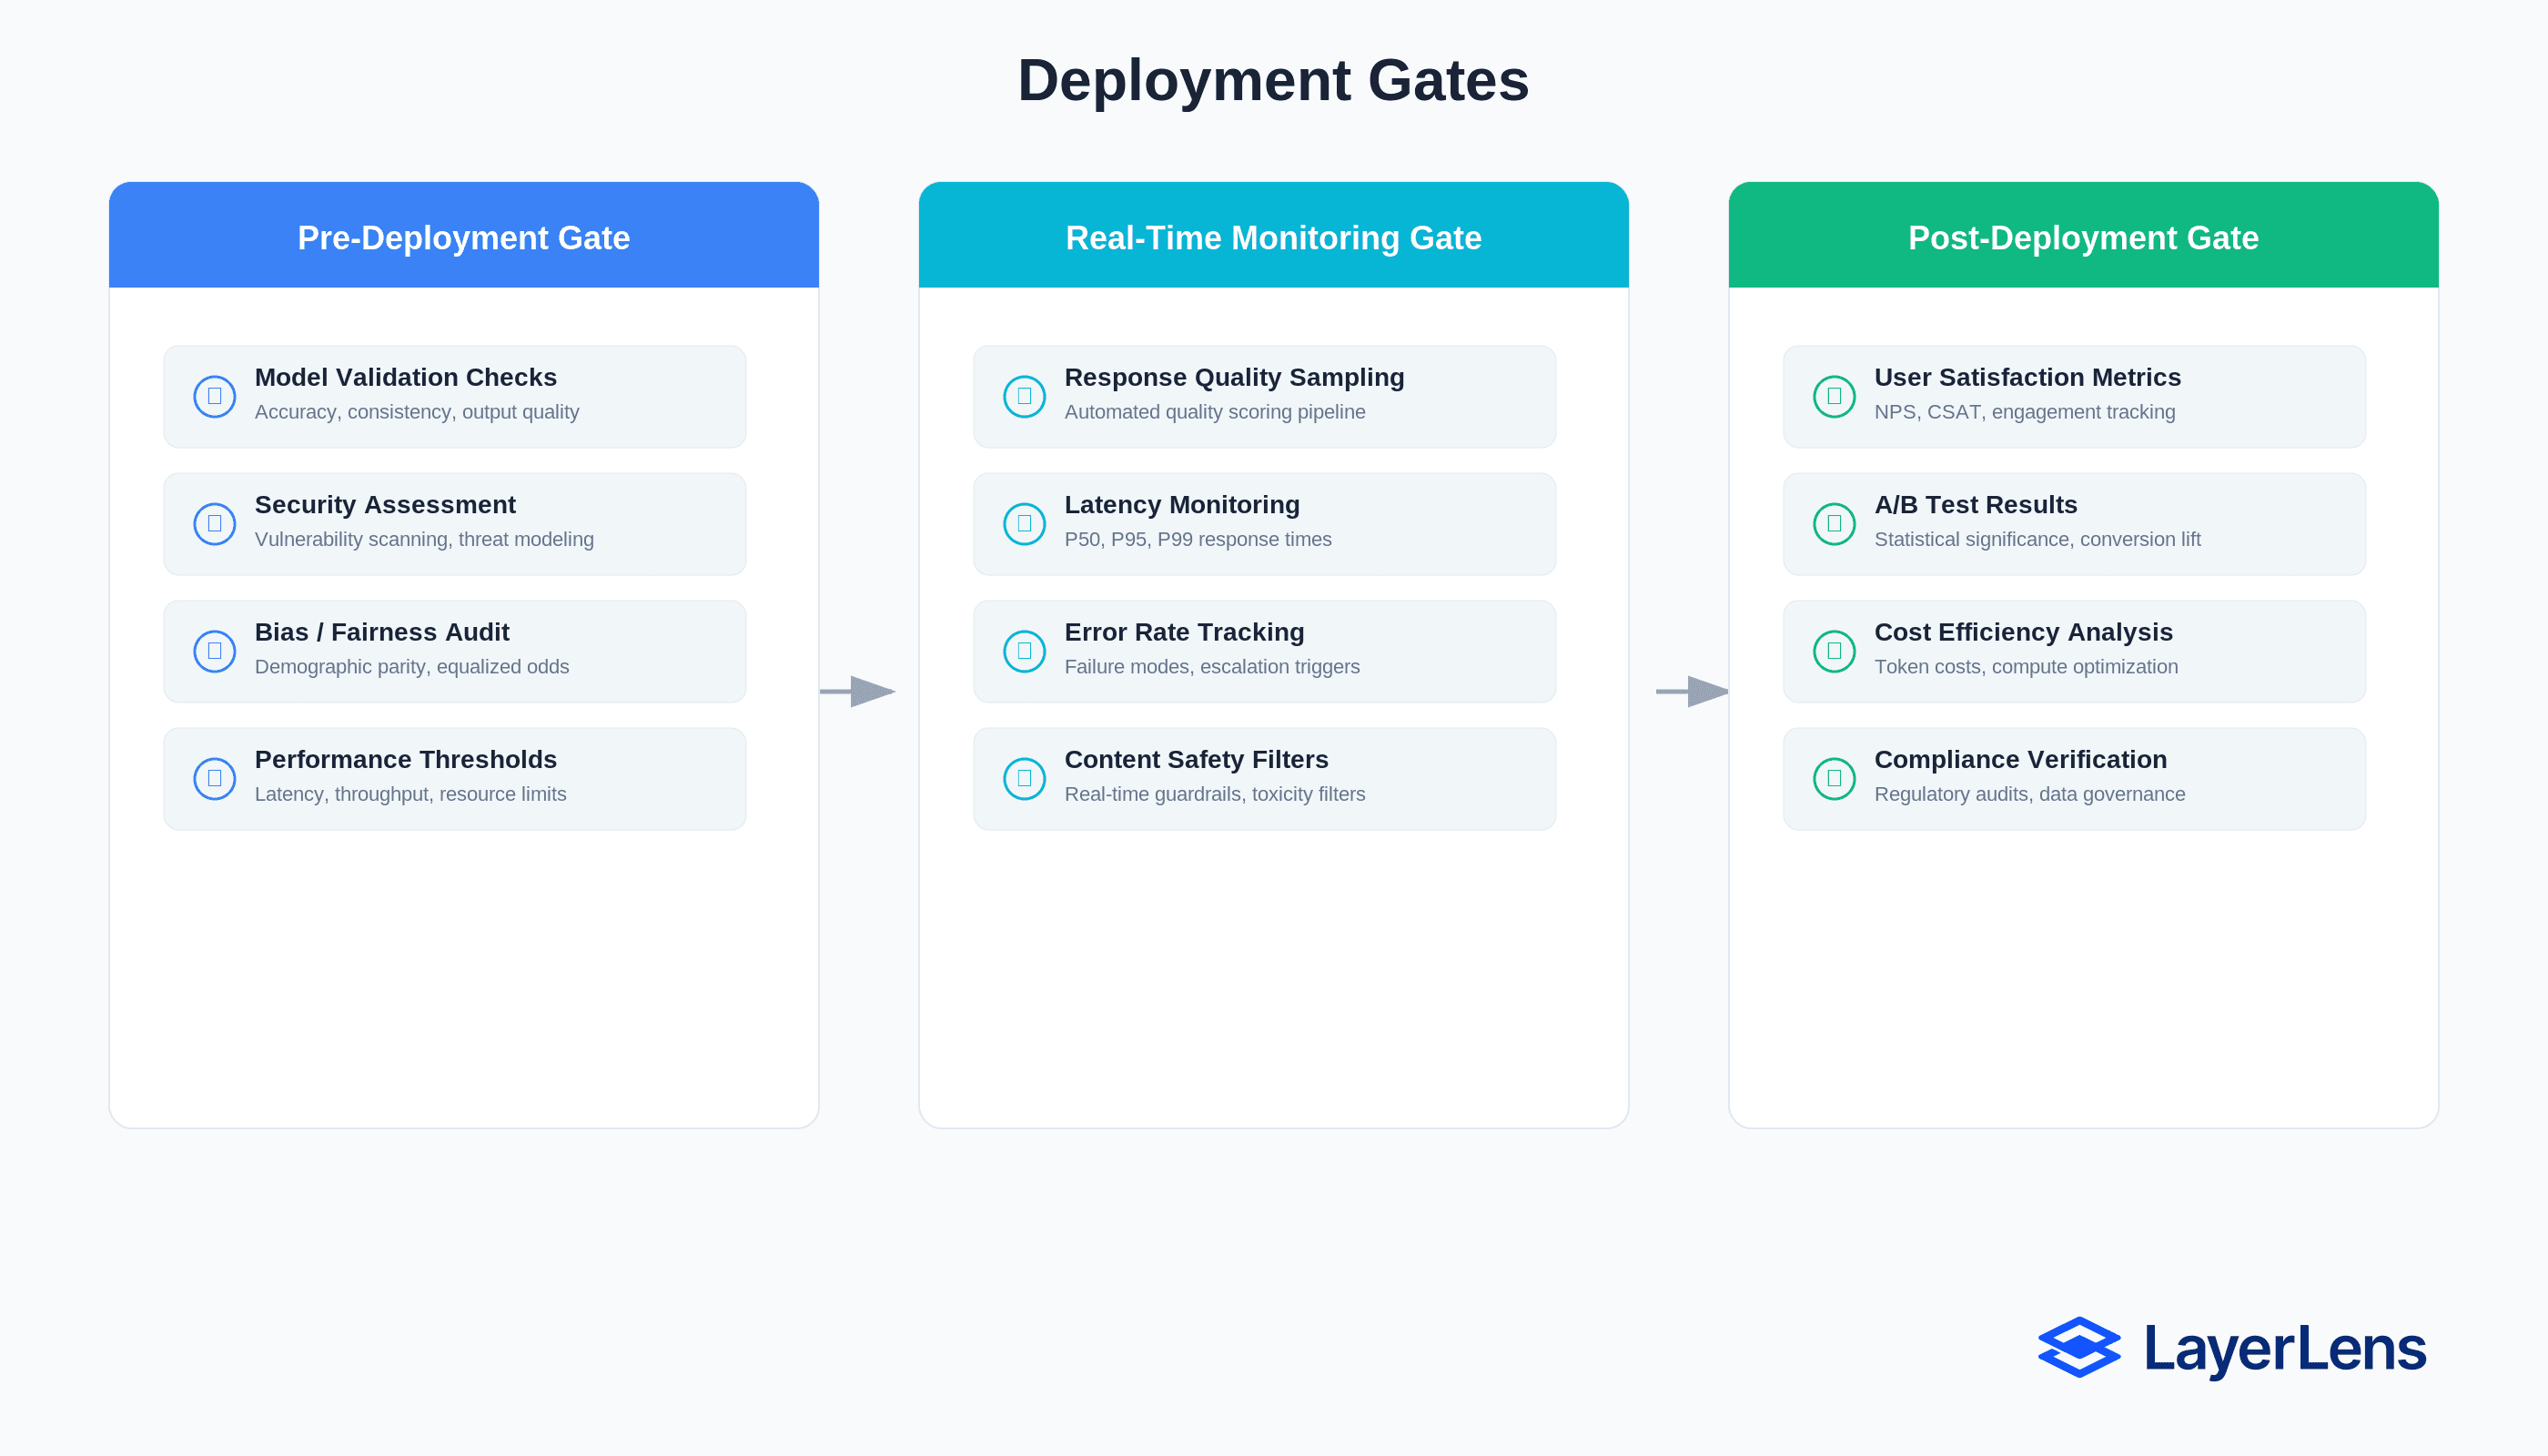
5. Governance and Deployment Gates
Tie evaluation metrics directly to deployment authority.
Define rejection, rollback, and escalation thresholds.
LayerLens provides structured evaluation coverage across 160+ models and 200+ benchmarks.
Stratix Premium extends lifecycle governance and monitoring
Conclusion: From Benchmark Scores to Deployment Control
LLM evaluation cannot end at model comparison. Benchmarks reveal capability under controlled conditions; they do not guarantee behavior under real traffic. Production reliability emerges from infrastructure — not from a single score.
An effective LLM evaluation framework transforms evaluation from a reporting exercise into a control system. Pre-deployment gating prevents weak candidates from shipping. Shadow deployment exposes real-world variance before exposure. Continuous evaluation and drift detection surface degradation early.
overnance ensures that metrics drive deployment decisions rather than sit in dashboards.
Organizations that treat evaluation as infrastructure ship faster, rollback less, and reduce incident response time. Organizations that treat evaluation as a benchmark score discover failure through customers.
Benchmarks generate signals.
An LLM evaluation framework converts those signals into operational confidence.
Frequently Asked Questions
What is the difference between LLM benchmarks and production evaluation?
Benchmarks measure performance on static datasets. Production evaluation measures behavior under live traffic and drift.
How often should LLMs be evaluated in production?
Continuously. Pre-deployment gating, shadow validation, and ongoing monitoring are required.
What metrics matter most?
Task-specific accuracy, safety violations, latency percentiles, cost per request, and drift detection.
What is LLM drift?
Statistically significant degradation caused by changing input distributions or infrastructure behavior.
Key Takeaways
An effective LLM evaluation framework:
Aligns metrics to business KPIs
Gates deployment on defined thresholds
Uses shadow validation
Runs continuous monitoring
Detects drift statistically
Connects metrics to governance
Benchmarks provide signals.
An evaluation framework converts signals into deployment safety.