
AgentGraph is Live: See Every Decision Your Agent Made
Author:
The LayerLens Team
Last updated:
Published:
The LayerLens team ships evaluation infrastructure. This week, Stratix got a major upgrade to how agent traces are visualized, replayed, and evaluated in bulk.
TL;DR
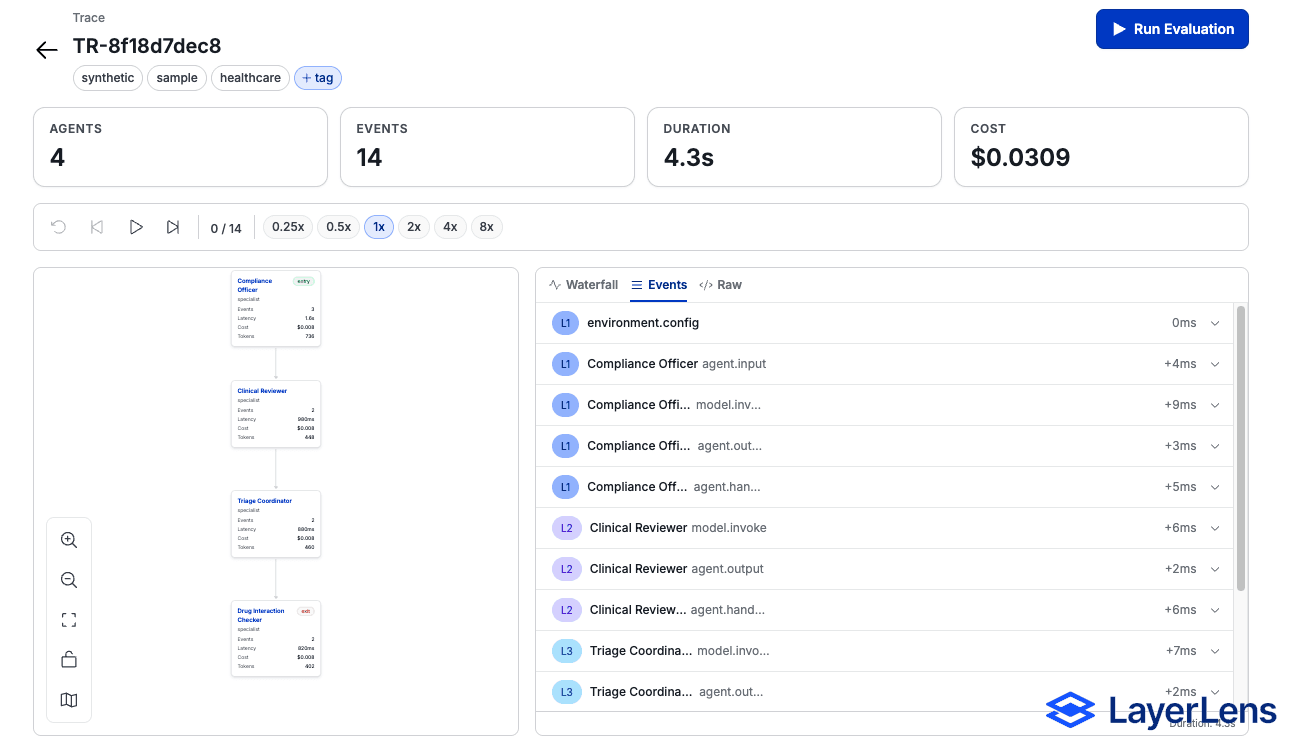
AgentGraph renders every agent trace as a directed graph, with event count, latency, cost, and token totals on each node.
A new Events panel surfaces Waterfall, Events, and Raw views of every step in a trace.
Playback lets teams replay any trace step by step at 1x, 2x, or 4x speed.
Bulk evaluation lets teams select multiple traces from the index and run one judge across all of them in a single operation.
Tag management is now available both inline on individual traces and in bulk from the trace index.
Why Trace Visualization Matters for Agent Evaluation
A production agent run is not a single inference call. It is a sequence of decisions: planning steps, tool invocations, retrieval operations, compliance checks, synthesis passes. Each step has its own latency profile, token cost, and failure surface. Collapsing all of that into a single aggregate score hides exactly the information teams need to diagnose regressions.
The problem with most trace inspection tools is that they show you a flat list of events. What happened at step 3? Scroll to it. What called what? Good luck mapping that from a timestamp list. AgentGraph solves this by turning the events stream into a graph where the structure of the agent run is immediately visible.
AgentGraph: Every Trace as a Directed Graph
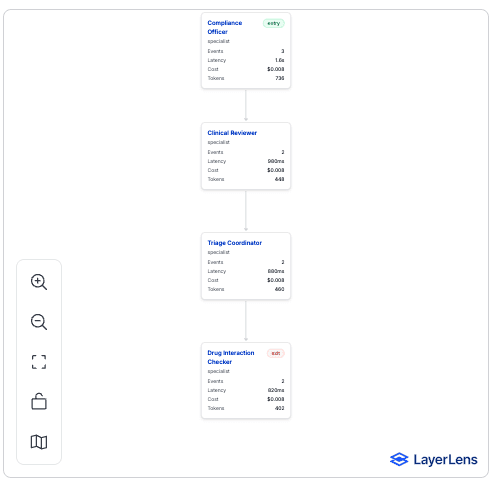
AgentGraph is built directly from the events stream already captured by Stratix. No additional instrumentation is needed. When a trace loads in the detail view, Stratix derives the agent graph automatically and renders it as a directed graph.
Each node in the graph represents an agent in the run. The node displays four metrics inline: event count, end-to-end latency for that agent's subtree, cumulative cost, and total token consumption. Edges represent the call relationships between agents. The Orchestrator node that spawned a Retriever and a Tool Caller will show two outbound edges, and both child nodes will show their own metrics independently.
The graph toolbar gives teams the controls to navigate large graphs: zoom in and out, fit the entire run to the viewport, toggle a minimap for overview navigation, and lock pan and scroll-zoom to prevent accidental repositioning during trace review sessions.
Events Panel: Three Views of Every Agent Step
Alongside the graph, a new Events panel surfaces the raw event data in three formats, selectable per session:
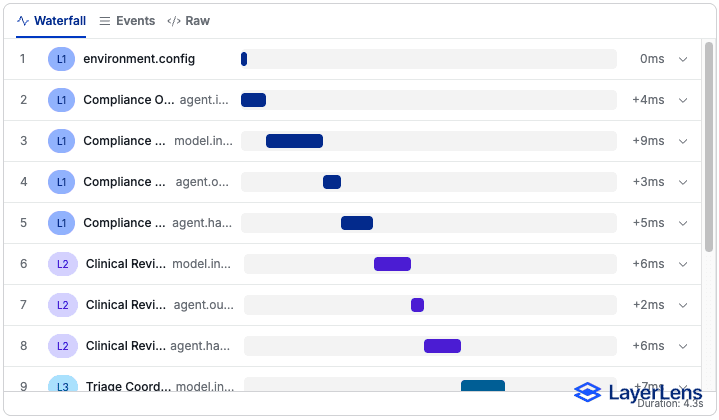
Waterfall renders a horizontal timeline with one bar per event, sized proportionally to its duration. This view is optimized for latency diagnosis: which step is the bottleneck? The Waterfall answer is visual in under a second.
Events is a structured table with one row per event. Each row shows the event label, full payload, sequence number, and cumulative cost and token totals up to that step. Clicking any row expands the full payload inline. This is the view most useful for correctness review: did the right information flow into each step?
Raw surfaces the complete JSON payload for any selected event. Every field Stratix captured is available: event ID, type, timestamp, duration, label, score, tokens, cost, and the full nested payload object. This is the view for when the structured table does not tell the whole story and the raw context matters.
Bulk Evaluation: Run One Judge Across Many Traces
The trace index page now supports bulk evaluation. Teams can select multiple traces from the table and apply any production judge to all selected traces in a single operation. The results populate back into the table immediately, with per-trace scores visible alongside the existing trace metadata.
This is particularly useful for regression testing across a batch of production traces after a model version change, and for auditing a week of agent runs against a compliance judge before a release window. The alternative, opening each trace individually and running evaluations one at a time, scales linearly with the size of the batch. Bulk eval does not.
Tag management at the index level ships alongside bulk eval. Teams can apply tags to N traces at once without opening each one, which makes it straightforward to label a set of traces for a specific experiment, release, or incident before analysis.
Playback: Replay Any Agent Run Step by Step
The playback bar ships on the trace detail page. Teams can play a trace forward at 1x, 2x, or 4x speed, step forward or back one event at a time, and reset to the beginning at any point. The right panel updates in sync with playback, revealing events incrementally as the bar advances through the trace.
This is most useful for demos and debugging sessions where the goal is to walk through an agent run in real time and explain what happened at each step. It is also useful for identifying the exact step where a metric degraded: play forward until the compliance score drops, then stop and inspect the raw payload at that event.
Key Takeaways
AgentGraph is derived from the existing Stratix events stream. No new instrumentation required to use it.
The Events panel replaces the need to export raw event logs for inspection. Three views cover the three most common diagnostic questions: latency, correctness, and raw context.
Bulk evaluation reduces the time to audit a batch of traces from linear-per-trace to a single operation.
Playback makes trace review sessions shareable: anyone on the team can replay the same run at the same speed and pause on the same event.
All features are live in Stratix now. Existing trace data works with all new views without re-ingestion.
Frequently Asked Questions
Does AgentGraph require changes to how traces are instrumented?
No. AgentGraph is derived automatically from the events stream that Stratix already captures. Any existing trace will render as a graph on the detail page without any additional setup.
What does each node in AgentGraph show?
Each node displays four metrics: the number of events attributed to that agent, the end-to-end latency for that agent's subtree, the cumulative cost, and the total token count. These are computed directly from the events stream for that agent.
How does bulk evaluation work?
From the trace index page, select multiple traces using the checkboxes in the table. Then select a judge from the bulk evaluation panel and run it. The judge executes against all selected traces and the results appear in the table without leaving the index view.
Can playback speed be adjusted mid-replay?
Yes. The speed toggle (1x, 2x, 4x) is available at any point during playback. Switching speeds takes effect immediately without restarting from the beginning.
What does the minimap toggle do?
The minimap toggle shows a compressed overview of the full agent graph in a corner of the graph viewport. It is off by default. For large multi-agent traces with many nodes, the minimap provides orientation context when the main viewport is zoomed in on a specific subgraph.
What is the lock toggle on the graph toolbar?
The lock toggle disables pan, scroll-zoom, pinch, and double-click-zoom on the agent graph. This is useful during review sessions where accidental repositioning of the graph would interrupt a walkthrough.
Is tag management available from the detail view as well as the index?
Yes. Tags can be added directly on any trace from the detail view using the inline pill editor. The trace index also supports bulk tag management: select multiple traces and apply a tag to all of them at once.
Methodology
All features described in this article are live in Stratix as of April 30, 2026. AgentGraph, the Events panel, playback, and bulk evaluation are available on all traces ingested via the Stratix SDK. The directed graph is derived from the events stream structure at render time and requires no additional SDK configuration. Sample trace data has been refreshed alongside this release to demonstrate the new views with realistic multi-agent runs.
Teams using Stratix can access all of these features in the trace index and trace detail pages today. To instrument a new agent and generate traces, see the Stratix documentation at app.layerlens.ai.